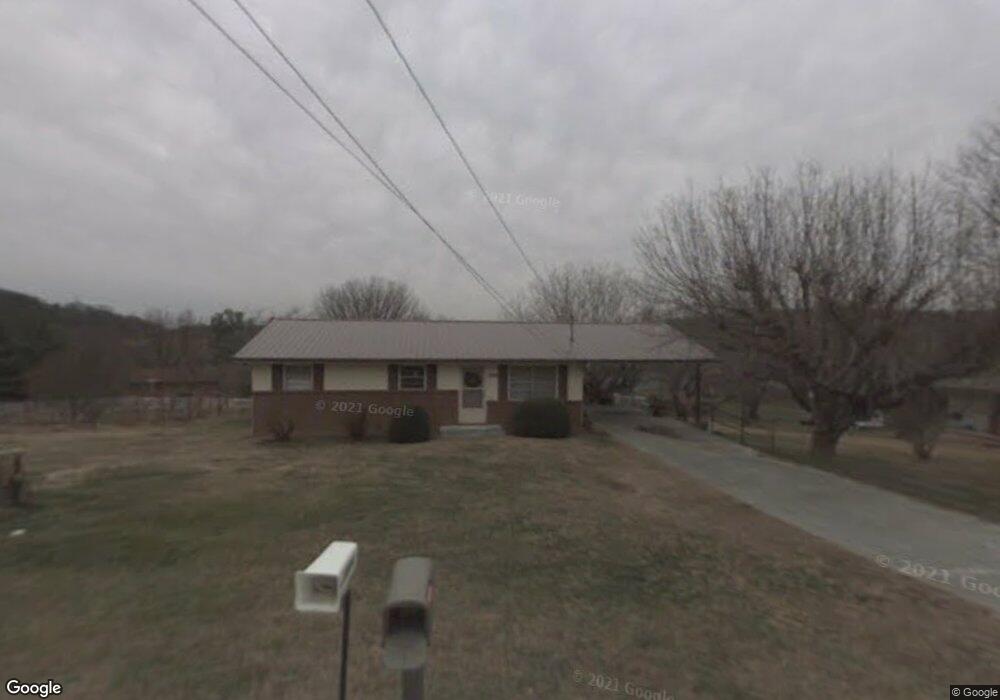
2290 Raritan Dr Morristown, TN 37813
Estimated Value: $202,000 - $218,000
--
Bed
1
Bath
988
Sq Ft
$214/Sq Ft
Est. Value
About This Home
This home is located at 2290 Raritan Dr, Morristown, TN 37813 and is currently estimated at $211,655, approximately $214 per square foot. 2290 Raritan Dr is a home located in Hamblen County with nearby schools including Union Heights Elementary School, East Ridge Middle School, and Morristown East High School.
Ownership History
Date
Name
Owned For
Owner Type
Purchase Details
Closed on
Apr 11, 2025
Sold by
Fugate David Art and Fugate Steven Earl
Bought by
Roberts Jayden S
Current Estimated Value
Home Financials for this Owner
Home Financials are based on the most recent Mortgage that was taken out on this home.
Original Mortgage
$167,200
Outstanding Balance
$166,912
Interest Rate
6.76%
Mortgage Type
New Conventional
Estimated Equity
$44,743
Purchase Details
Closed on
Jan 21, 2025
Sold by
Fugate Liza Kate
Bought by
Fugate David Art and Fugate Steven Earl
Purchase Details
Closed on
Nov 15, 1973
Bought by
Fugate Walford A and Fugate Kate
Create a Home Valuation Report for This Property
The Home Valuation Report is an in-depth analysis detailing your home's value as well as a comparison with similar homes in the area
Home Values in the Area
Average Home Value in this Area
Purchase History
| Date | Buyer | Sale Price | Title Company |
|---|---|---|---|
| Roberts Jayden S | $209,000 | Lakeway Title Services | |
| Fugate David Art | -- | None Listed On Document | |
| Fugate Walford A | $13,900 | -- |
Source: Public Records
Mortgage History
| Date | Status | Borrower | Loan Amount |
|---|---|---|---|
| Open | Roberts Jayden S | $167,200 |
Source: Public Records
Tax History Compared to Growth
Tax History
| Year | Tax Paid | Tax Assessment Tax Assessment Total Assessment is a certain percentage of the fair market value that is determined by local assessors to be the total taxable value of land and additions on the property. | Land | Improvement |
|---|---|---|---|---|
| 2024 | $490 | $24,850 | $4,325 | $20,525 |
| 2023 | $490 | $24,850 | $0 | $0 |
| 2022 | $490 | $24,850 | $4,325 | $20,525 |
| 2021 | $490 | $24,850 | $4,325 | $20,525 |
| 2020 | $490 | $24,850 | $4,325 | $20,525 |
| 2019 | $469 | $22,025 | $3,875 | $18,150 |
| 2018 | $469 | $22,025 | $3,875 | $18,150 |
| 2017 | $469 | $22,025 | $3,875 | $18,150 |
| 2016 | $438 | $22,025 | $3,875 | $18,150 |
| 2015 | $407 | $22,025 | $3,875 | $18,150 |
| 2014 | -- | $22,025 | $3,875 | $18,150 |
| 2013 | -- | $22,300 | $0 | $0 |
Source: Public Records
Map
Nearby Homes