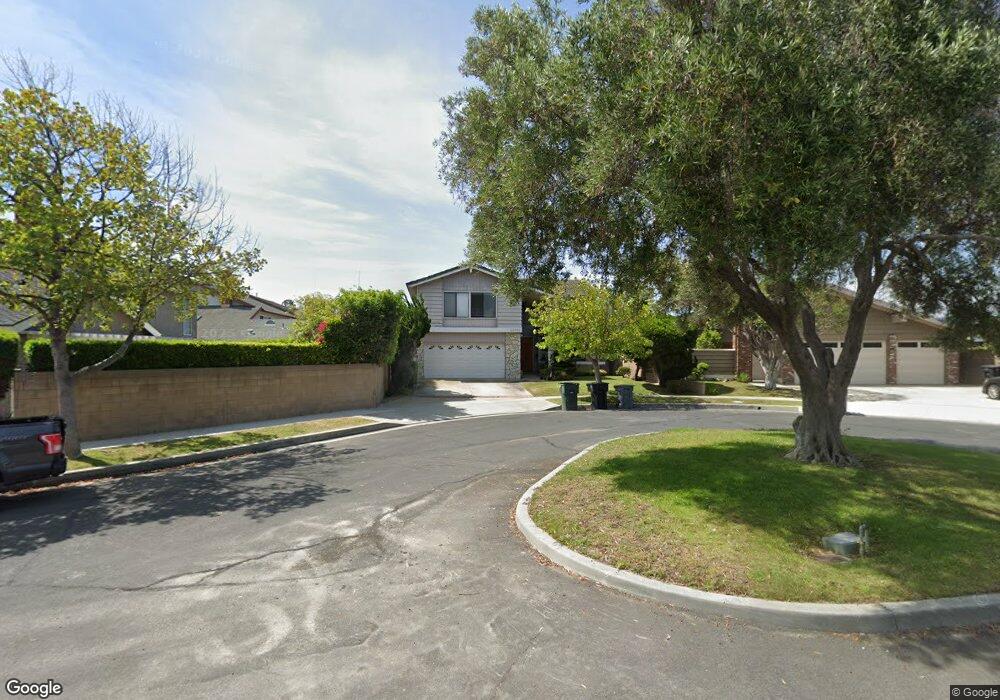
22909 Wade Ave Torrance, CA 90505
Southwood Sunray NeighborhoodEstimated Value: $1,572,729 - $1,850,000
4
Beds
4
Baths
3,017
Sq Ft
$563/Sq Ft
Est. Value
About This Home
This home is located at 22909 Wade Ave, Torrance, CA 90505 and is currently estimated at $1,698,432, approximately $562 per square foot. 22909 Wade Ave is a home located in Los Angeles County with nearby schools including Hickory Elementary School, Madrona Middle School, and Torrance High School.
Ownership History
Date
Name
Owned For
Owner Type
Purchase Details
Closed on
Feb 13, 2012
Sold by
Sun Tom Tsu Hung and Sun Joan T C
Bought by
Sun Tom Tsu Hung and Sun Joan T C
Current Estimated Value
Home Financials for this Owner
Home Financials are based on the most recent Mortgage that was taken out on this home.
Original Mortgage
$236,000
Outstanding Balance
$161,296
Interest Rate
3.84%
Mortgage Type
New Conventional
Estimated Equity
$1,537,136
Purchase Details
Closed on
Jan 23, 2002
Sold by
Sun Tsu Hung and Sun Joan T C
Bought by
Sun Tsu Hung and Sun Joan T C
Home Financials for this Owner
Home Financials are based on the most recent Mortgage that was taken out on this home.
Original Mortgage
$244,000
Interest Rate
7.15%
Purchase Details
Closed on
Mar 30, 1994
Sold by
Sun Joan
Bought by
Sun Tsu Hung
Purchase Details
Closed on
Feb 16, 1994
Sold by
Sun Tsu Hung and Sun Joan T C
Bought by
Sun Tsu Hung and Sun C T
Create a Home Valuation Report for This Property
The Home Valuation Report is an in-depth analysis detailing your home's value as well as a comparison with similar homes in the area
Home Values in the Area
Average Home Value in this Area
Purchase History
| Date | Buyer | Sale Price | Title Company |
|---|---|---|---|
| Sun Tom Tsu Hung | -- | First American Title Company | |
| Sun Tsu Hung | -- | North American Title Co | |
| Sun Tsu Hung | -- | Title Land Company | |
| Sun Tsu Hung | -- | -- |
Source: Public Records
Mortgage History
| Date | Status | Borrower | Loan Amount |
|---|---|---|---|
| Open | Sun Tom Tsu Hung | $236,000 | |
| Closed | Sun Tsu Hung | $244,000 |
Source: Public Records
Tax History Compared to Growth
Tax History
| Year | Tax Paid | Tax Assessment Tax Assessment Total Assessment is a certain percentage of the fair market value that is determined by local assessors to be the total taxable value of land and additions on the property. | Land | Improvement |
|---|---|---|---|---|
| 2025 | $3,607 | $290,467 | $76,322 | $214,145 |
| 2024 | $3,607 | $284,773 | $74,826 | $209,947 |
| 2023 | $3,546 | $279,190 | $73,359 | $205,831 |
| 2022 | $3,497 | $273,717 | $71,921 | $201,796 |
| 2021 | $3,416 | $268,351 | $70,511 | $197,840 |
| 2019 | $3,320 | $260,393 | $68,420 | $191,973 |
| 2018 | $3,183 | $255,288 | $67,079 | $188,209 |
| 2016 | $3,010 | $245,376 | $64,475 | $180,901 |
| 2015 | $2,946 | $241,691 | $63,507 | $178,184 |
| 2014 | $2,880 | $236,957 | $62,263 | $174,694 |
Source: Public Records
Map
Nearby Homes
- 22703 Elm Ave
- 2333 W 228th St
- 2605 Sepulveda Blvd Unit 216
- 2605 Sepulveda Blvd Unit 221
- 2237 W 230th Place
- 2830 W 235th St
- 2370 W 235th Place
- 2801 Sepulveda Blvd Unit 50
- 2801 Sepulveda Blvd Unit 34
- 2250 Santa fe Ave
- 2709 Orange Ave
- 2170 W 230th St
- 2123 Shelburne Way Unit 29
- 2800 Plaza Del Amo Unit 415
- 2800 Plaza Del Amo Unit 20
- 2800 Plaza Del Amo Unit 92
- 2119 Shelburne Way
- 2934 W 227th St
- 2577 Plaza Del Amo Unit 730
- 2559 Plaza Del Amo Unit 207
- 22905 Wade Ave
- 22917 Wade Ave
- 22921 Wade Ave
- 22913 Wade Ave
- 2531 W 230th St
- 2535 W 230th St
- 2525 W 230th St
- 22912 Date Ave
- 22906 Date Ave
- 2519 W 230th St
- 22902 Date Ave
- 22902 Wade Ave
- 22904 Wade Ave
- 22918 Wade Ave
- 22820 Date Ave
- 22916 Wade Ave
- 22906 Wade Ave
- 22920 Wade Ave
- 22914 Wade Ave
- 22908 Wade Ave