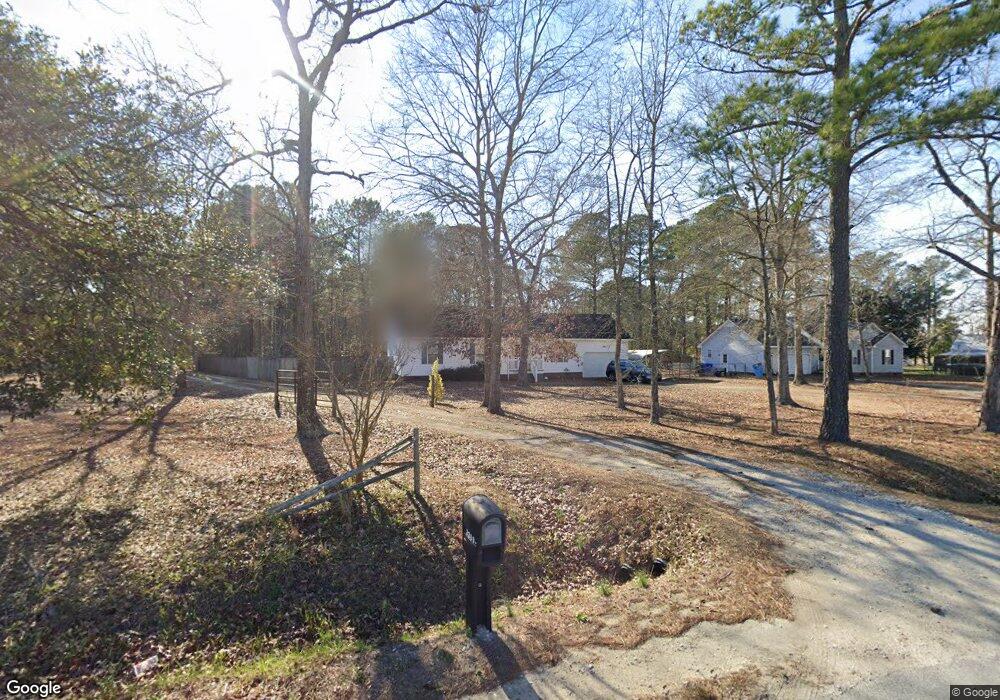
2293 Catherine Lake Rd Richlands, NC 28574
Estimated Value: $229,000 - $248,271
3
Beds
2
Baths
1,256
Sq Ft
$189/Sq Ft
Est. Value
About This Home
This home is located at 2293 Catherine Lake Rd, Richlands, NC 28574 and is currently estimated at $237,818, approximately $189 per square foot. 2293 Catherine Lake Rd is a home located in Onslow County with nearby schools including Richlands Elementary School, Trexler Middle School, and Richlands High School.
Ownership History
Date
Name
Owned For
Owner Type
Purchase Details
Closed on
Jun 7, 2021
Sold by
Senbertrand Joshua Z and Senbertrand Jessica A
Bought by
Allegri John A and Allegri Debra A
Current Estimated Value
Home Financials for this Owner
Home Financials are based on the most recent Mortgage that was taken out on this home.
Original Mortgage
$166,132
Interest Rate
2.9%
Mortgage Type
VA
Purchase Details
Closed on
Nov 21, 2014
Sold by
Senbertrand Joshua Z
Bought by
Senbertrand Joshua Z and Senbertrand Jessica A
Home Financials for this Owner
Home Financials are based on the most recent Mortgage that was taken out on this home.
Original Mortgage
$118,336
Interest Rate
4%
Mortgage Type
VA
Purchase Details
Closed on
Mar 17, 2009
Sold by
Hsbc Mortgage Services Inc
Bought by
Senbertrand Joshua Z
Home Financials for this Owner
Home Financials are based on the most recent Mortgage that was taken out on this home.
Original Mortgage
$127,150
Interest Rate
5.18%
Mortgage Type
VA
Purchase Details
Closed on
Nov 18, 2008
Sold by
Redmond Jesse E and Redmond Catherine
Bought by
Hsbc Mortgage Services Inc
Create a Home Valuation Report for This Property
The Home Valuation Report is an in-depth analysis detailing your home's value as well as a comparison with similar homes in the area
Home Values in the Area
Average Home Value in this Area
Purchase History
| Date | Buyer | Sale Price | Title Company |
|---|---|---|---|
| Allegri John A | $161,000 | None Available | |
| Senbertrand Joshua Z | -- | None Available | |
| Senbertrand Joshua Z | $124,500 | None Available | |
| Hsbc Mortgage Services Inc | $103,168 | None Available |
Source: Public Records
Mortgage History
| Date | Status | Borrower | Loan Amount |
|---|---|---|---|
| Previous Owner | Allegri John A | $166,132 | |
| Previous Owner | Senbertrand Joshua Z | $118,336 | |
| Previous Owner | Senbertrand Joshua Z | $127,150 |
Source: Public Records
Tax History Compared to Growth
Tax History
| Year | Tax Paid | Tax Assessment Tax Assessment Total Assessment is a certain percentage of the fair market value that is determined by local assessors to be the total taxable value of land and additions on the property. | Land | Improvement |
|---|---|---|---|---|
| 2025 | $1,045 | $159,485 | $40,000 | $119,485 |
| 2024 | $1,045 | $159,485 | $40,000 | $119,485 |
| 2023 | $1,045 | $159,485 | $40,000 | $119,485 |
| 2022 | $1,045 | $159,485 | $40,000 | $119,485 |
| 2021 | $827 | $117,240 | $28,000 | $89,240 |
| 2020 | $827 | $117,240 | $28,000 | $89,240 |
| 2019 | $827 | $117,240 | $28,000 | $89,240 |
| 2018 | $827 | $117,240 | $28,000 | $89,240 |
| 2017 | $794 | $117,660 | $25,000 | $92,660 |
| 2016 | $794 | $117,660 | $0 | $0 |
| 2015 | $794 | $117,660 | $0 | $0 |
| 2014 | $794 | $117,660 | $0 | $0 |
Source: Public Records
Map
Nearby Homes
- 109 Floyd Pond Ln
- 119 Edgewater Ln
- 105 Linden Rd
- 106 Orchard Dr
- 227 Bannermans Mill Rd
- 235 Westfield Dr
- 150 Mattie Ln
- 224 Rowland Dr
- 112 Burrell Ln
- 108 Burrell Ln
- 712 Addor Dr
- 503 Hester Ct
- 2037 Catherine Lake Rd
- 250 Rowland Dr
- 260 Rowland Dr
- 146 Saint Rd
- 144 Saint Rd
- 204 Chappell Creek Ct
- 200 Silver Ct
- 501 Bannermans Mill Rd
- 2297 Catherine Lake Rd
- 2287 Catherine Lake Rd
- 2301 Catherine Lake Rd
- 2288 Catherine Lake Rd
- 2288 Catherine Lake Rd
- 2277 Catherine Lake Rd
- 100 Virginias Landing Ct
- 102 Virginias Landing Ct
- 104 Virginia''S Landing Ct
- 115 Oliver Cooper Rd
- 104 Virginias Landing Ct
- 106 Virginias Landing Ct
- 101 Gobbler Way
- 2271 Catherine Lake Rd
- 103 Gobblers Way
- 108 Virginia's Landing Ct
- 119 Oliver Cooper Rd
- 108 Virginias Landing Ct
- 112 Virginia's Landing Ct
- 110 Virginias Landing Ct