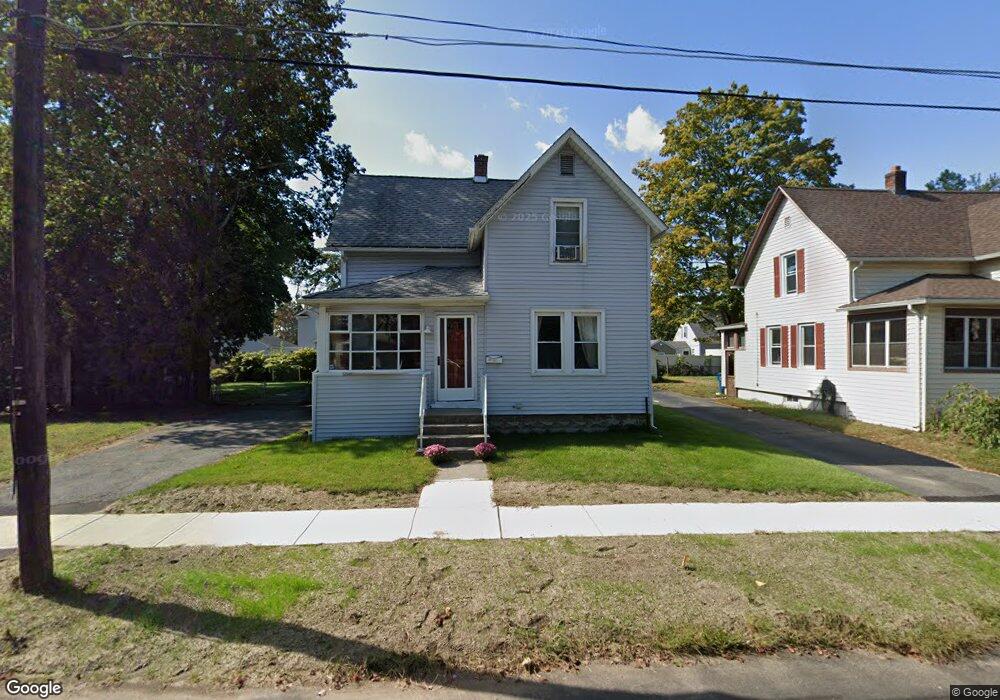
23 Cass Ave West Springfield, MA 01089
Estimated Value: $282,000 - $316,621
3
Beds
2
Baths
1,296
Sq Ft
$236/Sq Ft
Est. Value
About This Home
This home is located at 23 Cass Ave, West Springfield, MA 01089 and is currently estimated at $305,405, approximately $235 per square foot. 23 Cass Ave is a home located in Hampden County with nearby schools including St Thomas The Apostle School.
Ownership History
Date
Name
Owned For
Owner Type
Purchase Details
Closed on
Jun 1, 2007
Sold by
Charette Wayne M
Bought by
Carter Mary Jane and Carter Vernon
Current Estimated Value
Home Financials for this Owner
Home Financials are based on the most recent Mortgage that was taken out on this home.
Original Mortgage
$131,925
Outstanding Balance
$80,943
Interest Rate
6.24%
Mortgage Type
Purchase Money Mortgage
Estimated Equity
$224,462
Purchase Details
Closed on
Jul 17, 2003
Sold by
Manning Gloria R and Bielski Karen L
Bought by
Charette Wayne M
Home Financials for this Owner
Home Financials are based on the most recent Mortgage that was taken out on this home.
Original Mortgage
$111,600
Interest Rate
5.34%
Mortgage Type
Purchase Money Mortgage
Create a Home Valuation Report for This Property
The Home Valuation Report is an in-depth analysis detailing your home's value as well as a comparison with similar homes in the area
Home Values in the Area
Average Home Value in this Area
Purchase History
| Date | Buyer | Sale Price | Title Company |
|---|---|---|---|
| Carter Mary Jane | $175,900 | -- | |
| Charette Wayne M | $124,000 | -- |
Source: Public Records
Mortgage History
| Date | Status | Borrower | Loan Amount |
|---|---|---|---|
| Open | Carter Mary Jane | $131,925 | |
| Closed | Carter Mary Jane | $43,975 | |
| Previous Owner | Charette Wayne M | $111,600 |
Source: Public Records
Tax History Compared to Growth
Tax History
| Year | Tax Paid | Tax Assessment Tax Assessment Total Assessment is a certain percentage of the fair market value that is determined by local assessors to be the total taxable value of land and additions on the property. | Land | Improvement |
|---|---|---|---|---|
| 2025 | $3,523 | $236,900 | $107,100 | $129,800 |
| 2024 | $3,346 | $225,900 | $107,100 | $118,800 |
| 2023 | $3,232 | $208,000 | $107,100 | $100,900 |
| 2022 | $2,935 | $186,200 | $97,200 | $89,000 |
| 2021 | $2,905 | $171,900 | $89,300 | $82,600 |
| 2020 | $2,919 | $171,800 | $89,300 | $82,500 |
| 2019 | $2,914 | $171,800 | $89,300 | $82,500 |
| 2018 | $2,929 | $171,800 | $89,300 | $82,500 |
| 2017 | $2,929 | $171,800 | $89,300 | $82,500 |
| 2016 | $2,861 | $168,400 | $85,900 | $82,500 |
| 2015 | $2,805 | $165,100 | $84,200 | $80,900 |
| 2014 | $680 | $165,100 | $84,200 | $80,900 |
Source: Public Records
Map
Nearby Homes