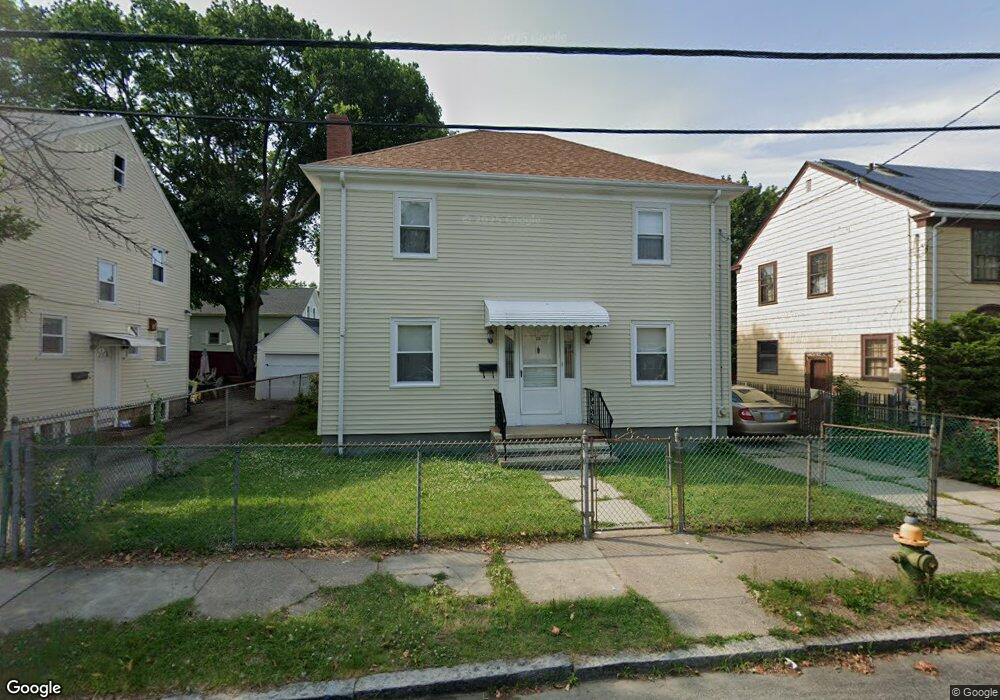
23 Fisk St Providence, RI 02905
Washington Park NeighborhoodEstimated Value: $400,000 - $437,000
3
Beds
3
Baths
1,550
Sq Ft
$265/Sq Ft
Est. Value
About This Home
This home is located at 23 Fisk St, Providence, RI 02905 and is currently estimated at $410,818, approximately $265 per square foot. 23 Fisk St is a home located in Providence County with nearby schools including Asa Messer Elementary School, Charles N. Fortes Elementary School, and Alan Shawn Feinstein Elementary.
Ownership History
Date
Name
Owned For
Owner Type
Purchase Details
Closed on
Feb 11, 2025
Sold by
Chin Ming and Lepore Christine M
Bought by
Chin Ming
Current Estimated Value
Purchase Details
Closed on
May 12, 2022
Sold by
Chin Ming
Bought by
Chin Ming and Lepore Christine M
Create a Home Valuation Report for This Property
The Home Valuation Report is an in-depth analysis detailing your home's value as well as a comparison with similar homes in the area
Home Values in the Area
Average Home Value in this Area
Purchase History
| Date | Buyer | Sale Price | Title Company |
|---|---|---|---|
| Chin Ming | -- | None Available | |
| Chin Ming | -- | None Available | |
| Chin Ming | -- | None Available | |
| Chin Ming | -- | None Available | |
| Chin Ming | -- | None Available | |
| Chin Ming | -- | None Available |
Source: Public Records
Tax History Compared to Growth
Tax History
| Year | Tax Paid | Tax Assessment Tax Assessment Total Assessment is a certain percentage of the fair market value that is determined by local assessors to be the total taxable value of land and additions on the property. | Land | Improvement |
|---|---|---|---|---|
| 2025 | $2,986 | $355,500 | $119,800 | $235,700 |
| 2024 | $5,588 | $304,500 | $75,900 | $228,600 |
| 2023 | $5,588 | $304,500 | $75,900 | $228,600 |
| 2022 | $5,420 | $304,500 | $75,900 | $228,600 |
| 2021 | $4,782 | $194,700 | $33,500 | $161,200 |
| 2020 | $4,782 | $194,700 | $33,500 | $161,200 |
| 2019 | $4,782 | $194,700 | $33,500 | $161,200 |
| 2018 | $3,848 | $120,400 | $30,400 | $90,000 |
| 2017 | $3,848 | $120,400 | $30,400 | $90,000 |
| 2016 | $3,848 | $120,400 | $30,400 | $90,000 |
| 2015 | $3,873 | $117,000 | $30,400 | $86,600 |
| 2014 | $3,949 | $117,000 | $30,400 | $86,600 |
| 2013 | $3,949 | $117,000 | $30,400 | $86,600 |
Source: Public Records
Map
Nearby Homes