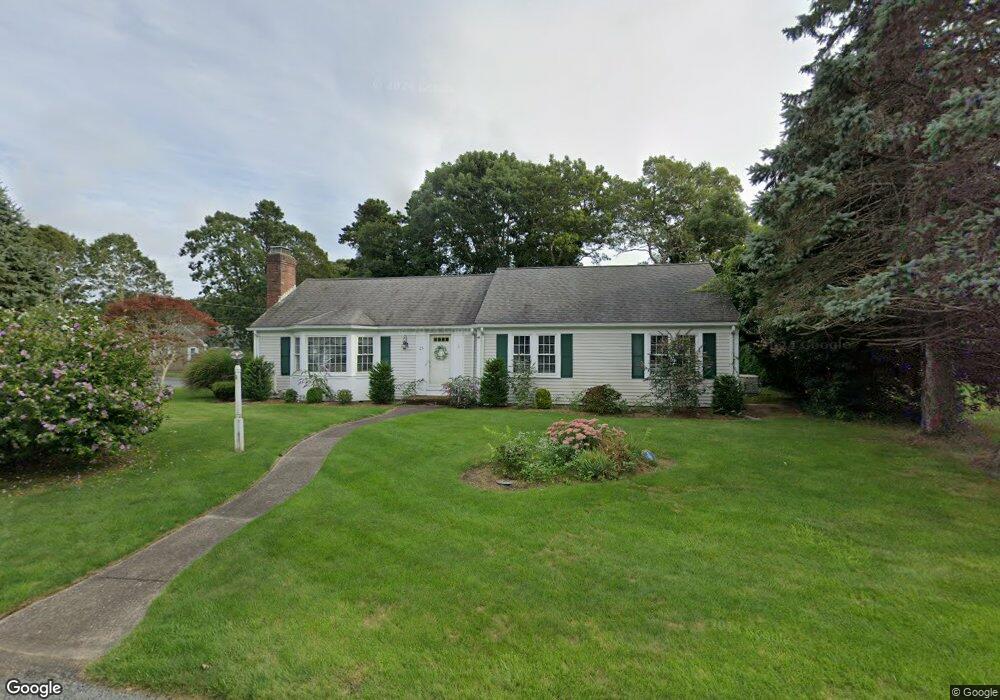
23 Golfers Cir South Yarmouth, MA 02664
Estimated Value: $747,850 - $840,000
3
Beds
3
Baths
1,746
Sq Ft
$459/Sq Ft
Est. Value
About This Home
This home is located at 23 Golfers Cir, South Yarmouth, MA 02664 and is currently estimated at $801,963, approximately $459 per square foot. 23 Golfers Cir is a home located in Barnstable County with nearby schools including Dennis-Yarmouth Regional High School and St. Pius X. School.
Ownership History
Date
Name
Owned For
Owner Type
Purchase Details
Closed on
Feb 28, 2024
Sold by
Smith Paul F and Smith Ann M
Bought by
Smith Ann M
Current Estimated Value
Purchase Details
Closed on
Jul 12, 1999
Sold by
Stagg Charles C and Stagg Jean D
Bought by
Smith Ann Marie T and Smith Paul F
Home Financials for this Owner
Home Financials are based on the most recent Mortgage that was taken out on this home.
Original Mortgage
$40,000
Interest Rate
7.19%
Mortgage Type
Purchase Money Mortgage
Create a Home Valuation Report for This Property
The Home Valuation Report is an in-depth analysis detailing your home's value as well as a comparison with similar homes in the area
Home Values in the Area
Average Home Value in this Area
Purchase History
| Date | Buyer | Sale Price | Title Company |
|---|---|---|---|
| Smith Ann M | -- | None Available | |
| Smith Ann Marie T | $195,500 | -- |
Source: Public Records
Mortgage History
| Date | Status | Borrower | Loan Amount |
|---|---|---|---|
| Previous Owner | Smith Ann Marie T | $250,000 | |
| Previous Owner | Smith Ann Marie T | $100,000 | |
| Previous Owner | Smith Ann Marie T | $40,000 |
Source: Public Records
Tax History Compared to Growth
Tax History
| Year | Tax Paid | Tax Assessment Tax Assessment Total Assessment is a certain percentage of the fair market value that is determined by local assessors to be the total taxable value of land and additions on the property. | Land | Improvement |
|---|---|---|---|---|
| 2025 | $5,207 | $735,500 | $231,000 | $504,500 |
| 2024 | $4,903 | $664,400 | $200,900 | $463,500 |
| 2023 | $4,714 | $581,200 | $169,600 | $411,600 |
| 2022 | $4,802 | $523,100 | $151,800 | $371,300 |
| 2021 | $4,460 | $466,500 | $151,800 | $314,700 |
| 2020 | $4,233 | $423,300 | $149,300 | $274,000 |
| 2019 | $3,874 | $383,600 | $149,300 | $234,300 |
| 2018 | $3,857 | $374,800 | $140,500 | $234,300 |
| 2017 | $3,755 | $374,800 | $140,500 | $234,300 |
| 2016 | $3,741 | $374,800 | $140,500 | $234,300 |
| 2015 | $3,586 | $357,200 | $140,500 | $216,700 |
Source: Public Records
Map
Nearby Homes
- 91 Chipping Green Cir
- 85 Keel Cape Dr
- 8 Viking Rock Rd
- 21 Green Way
- 23 Fairwood Rd
- 30 Pebble Beach Way
- 37 Winsome Rd
- 18 Curve Hill Rd
- 140 Diane Ave
- 1 Country Club Dr
- 38 N Dennis Rd
- 176 Beacon St
- 2 Buttercup Ln
- 4 Old Colony Way
- 32 Half Way
- 4 Raymond Ave
- 17 Fairmount Rd
- 17 Fairmount Rd
- 62 Old Fish House Rd