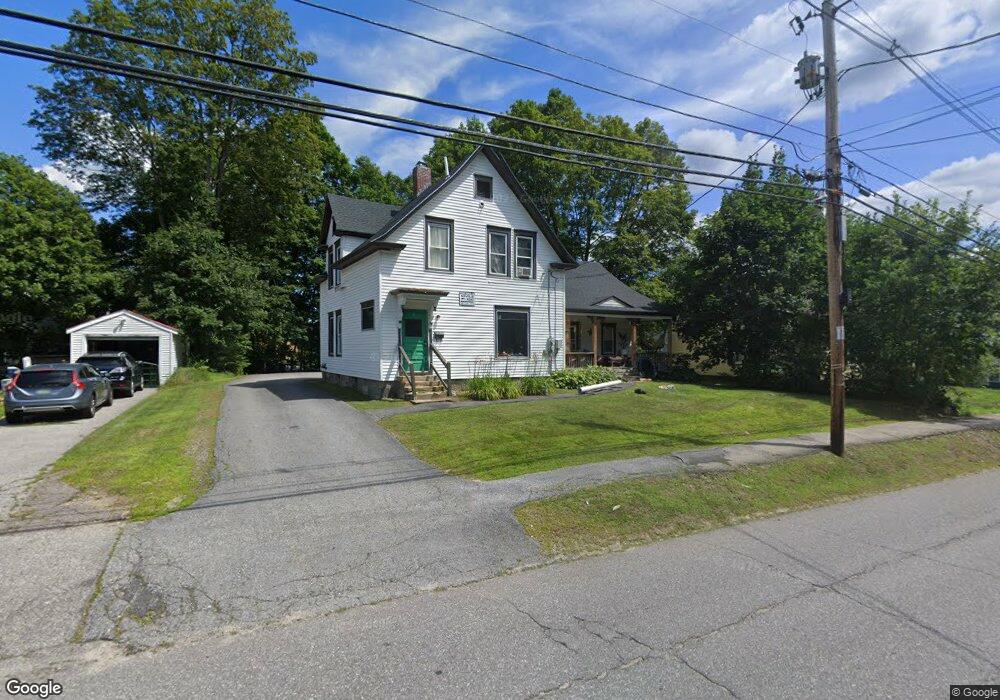
23 Langdon St Plymouth, NH 03264
Estimated Value: $351,000 - $418,931
6
Beds
2
Baths
2,560
Sq Ft
$151/Sq Ft
Est. Value
About This Home
This home is located at 23 Langdon St, Plymouth, NH 03264 and is currently estimated at $386,733, approximately $151 per square foot. 23 Langdon St is a home located in Grafton County with nearby schools including Plymouth Elementary School, Plymouth Regional High School, and Mountain Village Charter School.
Ownership History
Date
Name
Owned For
Owner Type
Purchase Details
Closed on
Nov 1, 2011
Sold by
Spring Creek Realty
Bought by
Neville Point Land Svc
Current Estimated Value
Purchase Details
Closed on
Jul 10, 2007
Sold by
Blanchette William E and Blanchette Carla A
Bought by
Spring Creek Realty
Home Financials for this Owner
Home Financials are based on the most recent Mortgage that was taken out on this home.
Original Mortgage
$235,000
Interest Rate
6.39%
Mortgage Type
Purchase Money Mortgage
Create a Home Valuation Report for This Property
The Home Valuation Report is an in-depth analysis detailing your home's value as well as a comparison with similar homes in the area
Home Values in the Area
Average Home Value in this Area
Purchase History
| Date | Buyer | Sale Price | Title Company |
|---|---|---|---|
| Neville Point Land Svc | $199,900 | -- | |
| Spring Creek Realty | $225,000 | -- |
Source: Public Records
Mortgage History
| Date | Status | Borrower | Loan Amount |
|---|---|---|---|
| Previous Owner | Spring Creek Realty | $235,000 |
Source: Public Records
Tax History Compared to Growth
Tax History
| Year | Tax Paid | Tax Assessment Tax Assessment Total Assessment is a certain percentage of the fair market value that is determined by local assessors to be the total taxable value of land and additions on the property. | Land | Improvement |
|---|---|---|---|---|
| 2024 | $8,531 | $339,600 | $95,500 | $244,100 |
| 2023 | $8,279 | $339,600 | $95,500 | $244,100 |
| 2022 | $8,979 | $285,600 | $48,400 | $237,200 |
| 2021 | $8,708 | $285,600 | $48,400 | $237,200 |
| 2020 | $8,137 | $285,600 | $48,400 | $237,200 |
| 2019 | $8,051 | $285,600 | $48,400 | $237,200 |
| 2018 | $7,183 | $283,900 | $48,400 | $235,500 |
| 2017 | $6,737 | $227,900 | $44,300 | $183,600 |
| 2016 | $5,736 | $227,900 | $44,300 | $183,600 |
| 2015 | $5,570 | $227,900 | $44,300 | $183,600 |
| 2014 | $5,454 | $227,900 | $44,300 | $183,600 |
| 2013 | $5,476 | $227,900 | $44,300 | $183,600 |
Source: Public Records
Map
Nearby Homes
- 25 Wentworth St
- 28, 29 &42 Railroad & Main Square
- 10 Hawthorne St
- 12 Broadway St
- 75 Pleasant St
- 6 Boe Rd
- 0 Binks Hill Rd
- 0 Oak Ridge Rd Unit 27
- 9 Blueberry Hill Rd Unit 8
- 18 Wildflower Ln Unit 208-97-8-01
- 72 Crescent St
- 20 Wildflower Ln Unit 208-97-9-2
- 20 Wildflower Ln Unit 208-97-9-1
- 263 Highland St
- 14 Heritage Hill Rd
- 585 N Ashland Rd
- 96 Fairway Dr Unit 1
- 29 Reservoir Heights Rd
- 64 Fairway Dr
- 193 New Hebron Rd