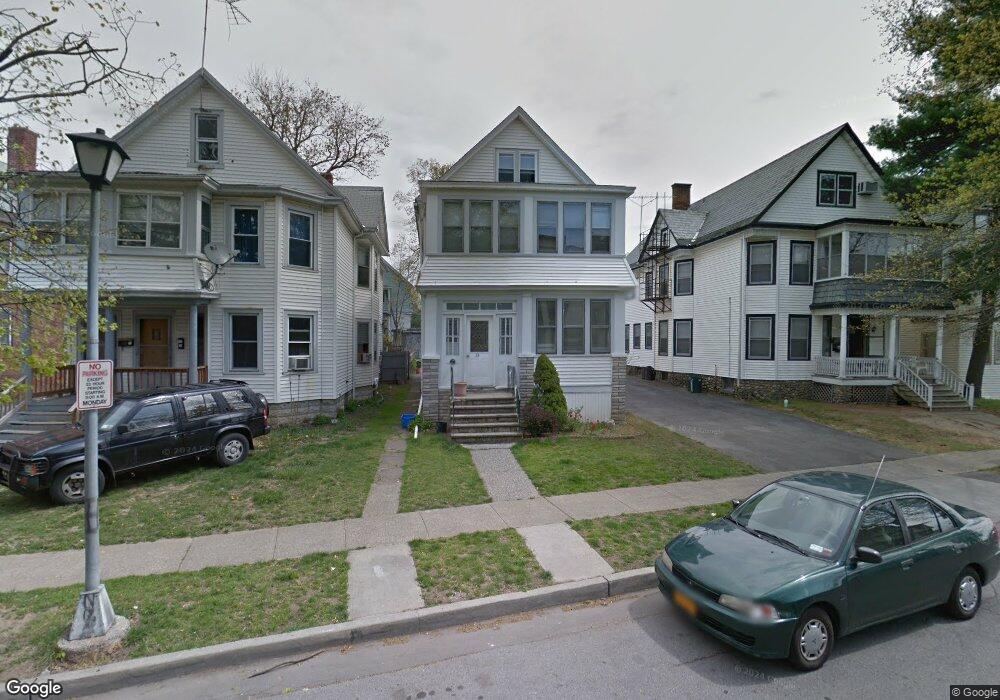
23 Lexington Ave Unit 2 Poughkeepsie, NY 12601
Estimated Value: $362,823 - $432,000
2
Beds
1
Bath
1,114
Sq Ft
$344/Sq Ft
Est. Value
About This Home
This home is located at 23 Lexington Ave Unit 2, Poughkeepsie, NY 12601 and is currently estimated at $383,706, approximately $344 per square foot. 23 Lexington Ave Unit 2 is a home located in Dutchess County with nearby schools including Poughkeepsie High School, Holy Trinity School, and Tabernacle Christian Academy.
Ownership History
Date
Name
Owned For
Owner Type
Purchase Details
Closed on
Nov 5, 2020
Sold by
Brissett Joyce and Thompson Carol
Bought by
June Emily
Current Estimated Value
Home Financials for this Owner
Home Financials are based on the most recent Mortgage that was taken out on this home.
Original Mortgage
$199,900
Outstanding Balance
$177,883
Interest Rate
2.8%
Mortgage Type
FHA
Estimated Equity
$205,823
Purchase Details
Closed on
Feb 21, 2014
Sold by
Brissett Joyce
Bought by
Brissett Joyce
Purchase Details
Closed on
Oct 5, 2012
Sold by
Brissett Joyce
Bought by
Brissett Joyce
Purchase Details
Closed on
Aug 15, 2000
Sold by
Smith Bryan F
Bought by
Pyle Eric R
Purchase Details
Closed on
Oct 6, 1999
Sold by
Jaim Sudimr K
Bought by
Smier
Create a Home Valuation Report for This Property
The Home Valuation Report is an in-depth analysis detailing your home's value as well as a comparison with similar homes in the area
Home Values in the Area
Average Home Value in this Area
Purchase History
| Date | Buyer | Sale Price | Title Company |
|---|---|---|---|
| June Emily | $250,000 | Misc Company | |
| Brissett Joyce | -- | -- | |
| Brissett Joyce | -- | -- | |
| Pyle Eric R | $324,950 | Vincent Catalano | |
| Smier | $292,500 | Niki Pagones |
Source: Public Records
Mortgage History
| Date | Status | Borrower | Loan Amount |
|---|---|---|---|
| Open | June Emily | $199,900 |
Source: Public Records
Tax History Compared to Growth
Tax History
| Year | Tax Paid | Tax Assessment Tax Assessment Total Assessment is a certain percentage of the fair market value that is determined by local assessors to be the total taxable value of land and additions on the property. | Land | Improvement |
|---|---|---|---|---|
| 2024 | $8,454 | $316,500 | $59,400 | $257,100 |
| 2023 | $7,448 | $298,600 | $59,400 | $239,200 |
| 2022 | $6,283 | $248,800 | $54,000 | $194,800 |
| 2021 | $6,110 | $205,600 | $54,000 | $151,600 |
| 2020 | $4,191 | $171,300 | $54,000 | $117,300 |
| 2019 | $4,017 | $155,700 | $54,000 | $101,700 |
| 2018 | $3,889 | $148,300 | $54,000 | $94,300 |
| 2017 | $3,544 | $141,200 | $54,000 | $87,200 |
| 2016 | $3,707 | $145,600 | $54,000 | $91,600 |
| 2015 | -- | $145,600 | $54,000 | $91,600 |
| 2014 | -- | $145,600 | $54,000 | $91,600 |
Source: Public Records
Map
Nearby Homes
- 23 Lexington Ave
- 21 Lexington Ave
- 21 Lexington Ave Unit 2
- 21 Lexington Ave Unit 1
- 25 Lexington Ave
- 25 Lexington Ave Unit 1
- 19 Lexington Ave
- 27 Lexington Ave
- 27 Lexington Ave Unit 210
- 17 Lexington Ave
- 17 Lexington Ave Unit 1
- 17 Lexington Ave Unit 2
- 212 Lexington St
- 22 Manitou Ave
- 18 Manitou Ave
- 29 Lexington Ave
- 20 Manitou Ave
- 20 Manitou Ave Unit 1
- 20 Manitou Ave Unit 2
- 24 Manitou Ave