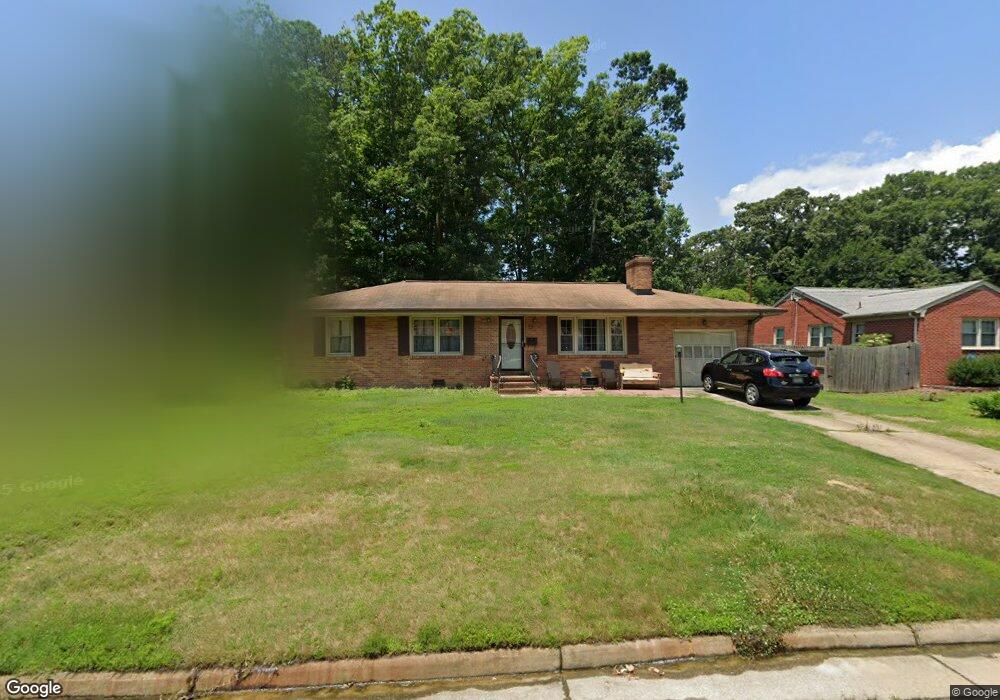
23 Meadow Creek Dr Newport News, VA 23608
McIntosh NeighborhoodEstimated Value: $262,907 - $283,000
3
Beds
2
Baths
1,171
Sq Ft
$234/Sq Ft
Est. Value
About This Home
This home is located at 23 Meadow Creek Dr, Newport News, VA 23608 and is currently estimated at $273,977, approximately $233 per square foot. 23 Meadow Creek Dr is a home located in Newport News City with nearby schools including Richneck Elementary School, Ella Fitzgerald Middle School, and Woodside High School.
Ownership History
Date
Name
Owned For
Owner Type
Purchase Details
Closed on
Nov 6, 2014
Sold by
Colson Erik L
Bought by
Seiler Danielle A
Current Estimated Value
Home Financials for this Owner
Home Financials are based on the most recent Mortgage that was taken out on this home.
Original Mortgage
$146,300
Outstanding Balance
$112,284
Interest Rate
4.13%
Mortgage Type
New Conventional
Estimated Equity
$161,693
Purchase Details
Closed on
Mar 12, 2014
Sold by
Secretary Of Veterans Affairs
Bought by
Colson Eirk L
Purchase Details
Closed on
Feb 26, 2014
Sold by
Professional Foreclosure Corp and Anderson Frank
Bought by
Sec Of Veterans Affairs
Purchase Details
Closed on
Aug 4, 2011
Sold by
Jaqua Charlene Marie and Anderson Shirley M
Bought by
Anderson Frank
Home Financials for this Owner
Home Financials are based on the most recent Mortgage that was taken out on this home.
Original Mortgage
$154,800
Interest Rate
4.51%
Mortgage Type
VA
Create a Home Valuation Report for This Property
The Home Valuation Report is an in-depth analysis detailing your home's value as well as a comparison with similar homes in the area
Home Values in the Area
Average Home Value in this Area
Purchase History
| Date | Buyer | Sale Price | Title Company |
|---|---|---|---|
| Seiler Danielle A | $154,000 | -- | |
| Colson Eirk L | $100,725 | -- | |
| Sec Of Veterans Affairs | $96,106 | -- | |
| Anderson Frank | $149,900 | -- |
Source: Public Records
Mortgage History
| Date | Status | Borrower | Loan Amount |
|---|---|---|---|
| Open | Seiler Danielle A | $146,300 | |
| Previous Owner | Anderson Frank | $154,800 |
Source: Public Records
Tax History Compared to Growth
Tax History
| Year | Tax Paid | Tax Assessment Tax Assessment Total Assessment is a certain percentage of the fair market value that is determined by local assessors to be the total taxable value of land and additions on the property. | Land | Improvement |
|---|---|---|---|---|
| 2025 | $2,800 | $255,900 | $69,400 | $186,500 |
| 2024 | $2,653 | $224,800 | $69,400 | $155,400 |
| 2023 | $2,711 | $217,300 | $64,900 | $152,400 |
| 2022 | $2,727 | $215,000 | $64,900 | $150,100 |
| 2021 | $2,136 | $175,100 | $59,000 | $116,100 |
| 2020 | $2,106 | $160,600 | $59,000 | $101,600 |
| 2019 | $1,989 | $151,400 | $59,000 | $92,400 |
| 2018 | $1,986 | $151,400 | $59,000 | $92,400 |
| 2017 | $1,986 | $151,400 | $59,000 | $92,400 |
| 2016 | $1,982 | $151,400 | $59,000 | $92,400 |
| 2015 | $1,976 | $151,400 | $59,000 | $92,400 |
| 2014 | $1,640 | $137,900 | $59,000 | $78,900 |
Source: Public Records
Map
Nearby Homes
- 708 Princess Ct
- 712 Princess Ct
- 12 Chowan Place
- 13025 Green Grove Ln
- 408 Chowan Place
- 459 Bryson Ct
- 182 Ridgewood Pkwy
- 421 Richneck Rd
- 202 Tower Ln
- 507 Chanticlar Ct
- 962 Red Oak Cir
- 844 Melrose Terrace
- 9 Friedman Place
- 802 Purdey Ct
- 173 Windsor Castle Dr
- 408 Joel Ct
- 471 Richneck Rd
- 714 Galahad Dr
- 552 Michael Irvin Dr
- 808 Melrose Terrace
- 21 Meadow Creek Dr
- 25 Meadow Creek Dr
- 19 Meadow Creek Dr
- 27 Meadow Creek Dr
- 14 Richland Dr
- 16 Richland Dr
- 22 Meadow Creek
- 12 Richland Dr
- 18 Richland Dr
- 29 Meadow Creek Dr
- 17 Meadow Creek Dr
- 20 Meadow Creek Dr
- 24 Meadow Creek Dr
- 10 Richland Dr
- 18 Meadow Creek Dr
- 20 Richland Dr
- 26 Meadow Creek Dr
- 15 Meadow Creek Dr
- 31 Meadow Creek Dr
- 8 Richland Dr