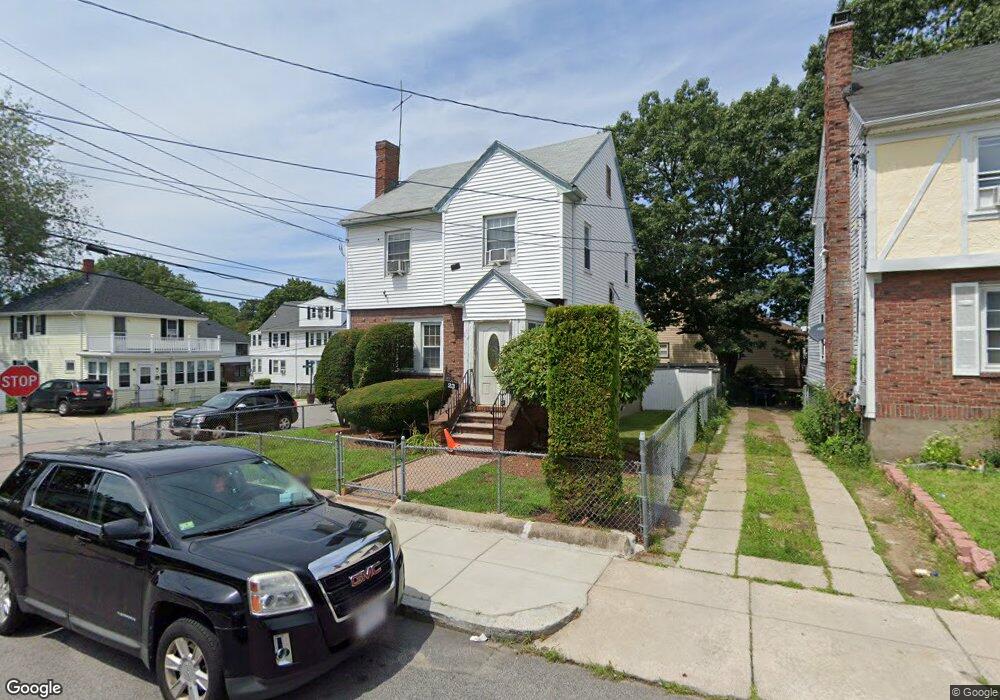
23 Owen St Mattapan, MA 02126
Southern Mattapan NeighborhoodEstimated Value: $547,000 - $661,000
3
Beds
1
Bath
1,260
Sq Ft
$476/Sq Ft
Est. Value
About This Home
This home is located at 23 Owen St, Mattapan, MA 02126 and is currently estimated at $600,356, approximately $476 per square foot. 23 Owen St is a home located in Suffolk County with nearby schools including Berea Seventh-day Adventist Academy.
Ownership History
Date
Name
Owned For
Owner Type
Purchase Details
Closed on
Dec 2, 1992
Sold by
Jones Robert C
Bought by
Hubbart Toni W and Hubbart Erice N
Current Estimated Value
Home Financials for this Owner
Home Financials are based on the most recent Mortgage that was taken out on this home.
Original Mortgage
$90,250
Interest Rate
8.22%
Mortgage Type
Purchase Money Mortgage
Purchase Details
Closed on
Feb 11, 1987
Sold by
Jones John M
Bought by
Jones Robert C
Create a Home Valuation Report for This Property
The Home Valuation Report is an in-depth analysis detailing your home's value as well as a comparison with similar homes in the area
Home Values in the Area
Average Home Value in this Area
Purchase History
| Date | Buyer | Sale Price | Title Company |
|---|---|---|---|
| Hubbart Toni W | $95,000 | -- | |
| Jones Robert C | $126,000 | -- |
Source: Public Records
Mortgage History
| Date | Status | Borrower | Loan Amount |
|---|---|---|---|
| Open | Jones Robert C | $201,600 | |
| Closed | Jones Robert C | $152,050 | |
| Closed | Jones Robert C | $90,250 | |
| Previous Owner | Jones Robert C | $30,000 |
Source: Public Records
Tax History Compared to Growth
Tax History
| Year | Tax Paid | Tax Assessment Tax Assessment Total Assessment is a certain percentage of the fair market value that is determined by local assessors to be the total taxable value of land and additions on the property. | Land | Improvement |
|---|---|---|---|---|
| 2025 | $5,255 | $453,800 | $151,200 | $302,600 |
| 2024 | $4,878 | $447,500 | $157,700 | $289,800 |
| 2023 | $4,577 | $426,200 | $150,200 | $276,000 |
| 2022 | $4,375 | $402,100 | $141,700 | $260,400 |
| 2021 | $4,232 | $396,600 | $141,700 | $254,900 |
| 2020 | $3,688 | $349,200 | $145,600 | $203,600 |
| 2019 | $3,440 | $326,400 | $109,500 | $216,900 |
| 2018 | $3,198 | $305,200 | $109,500 | $195,700 |
| 2017 | $3,198 | $302,000 | $109,500 | $192,500 |
| 2016 | $2,889 | $262,600 | $109,500 | $153,100 |
| 2015 | $2,365 | $195,300 | $84,300 | $111,000 |
| 2014 | $2,293 | $182,300 | $84,300 | $98,000 |
Source: Public Records
Map
Nearby Homes
- 124 Selden St
- 139 Selden St
- 30 Glenhill Rd
- 15-17 W Selden St
- 808 Morton St Unit 3
- 32 Crowell St
- 147 Fairmount St
- 18 Astoria St
- 23 Maryknoll St
- 44 Evans St
- 73 Stanton St
- 68 Mascot St
- 84-86 Codman Hill Ave
- 10 Sutton St
- 64 Stockton St
- 81 Mora St
- 183 Fuller St Unit 1
- 157 Delhi St
- 36 Oakridge St
- 5 Sutton St