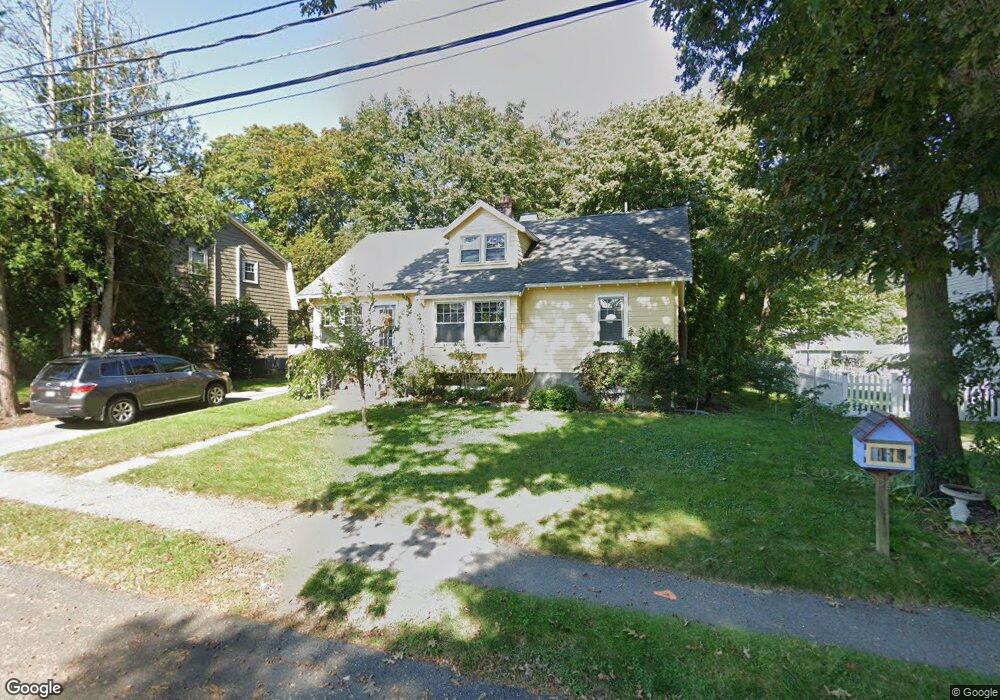
23 Thorpe Rd Needham Heights, MA 02494
Estimated Value: $1,207,417 - $1,360,000
3
Beds
2
Baths
1,034
Sq Ft
$1,250/Sq Ft
Est. Value
About This Home
This home is located at 23 Thorpe Rd, Needham Heights, MA 02494 and is currently estimated at $1,292,604, approximately $1,250 per square foot. 23 Thorpe Rd is a home located in Norfolk County with nearby schools including Mitchell Elementary School, High Rock Middle School, and Pollard Middle School.
Ownership History
Date
Name
Owned For
Owner Type
Purchase Details
Closed on
Apr 23, 1992
Sold by
Swift Extr Richard H
Bought by
Peirce Bruce H and Peirce Karen F
Current Estimated Value
Home Financials for this Owner
Home Financials are based on the most recent Mortgage that was taken out on this home.
Original Mortgage
$128,000
Interest Rate
8.78%
Mortgage Type
Purchase Money Mortgage
Create a Home Valuation Report for This Property
The Home Valuation Report is an in-depth analysis detailing your home's value as well as a comparison with similar homes in the area
Home Values in the Area
Average Home Value in this Area
Purchase History
| Date | Buyer | Sale Price | Title Company |
|---|---|---|---|
| Peirce Bruce H | $160,000 | -- |
Source: Public Records
Mortgage History
| Date | Status | Borrower | Loan Amount |
|---|---|---|---|
| Open | Peirce Bruce H | $107,000 | |
| Closed | Peirce Bruce H | $134,000 | |
| Closed | Peirce Bruce H | $136,000 | |
| Closed | Peirce Bruce H | $128,000 |
Source: Public Records
Tax History Compared to Growth
Tax History
| Year | Tax Paid | Tax Assessment Tax Assessment Total Assessment is a certain percentage of the fair market value that is determined by local assessors to be the total taxable value of land and additions on the property. | Land | Improvement |
|---|---|---|---|---|
| 2025 | $9,933 | $937,100 | $660,400 | $276,700 |
| 2024 | $10,602 | $846,800 | $524,200 | $322,600 |
| 2023 | $10,762 | $825,300 | $524,200 | $301,100 |
| 2022 | $10,045 | $751,300 | $459,800 | $291,500 |
| 2021 | $9,789 | $751,300 | $459,800 | $291,500 |
| 2020 | $9,338 | $747,600 | $460,500 | $287,100 |
| 2019 | $8,708 | $702,800 | $418,600 | $284,200 |
| 2018 | $8,349 | $702,800 | $418,600 | $284,200 |
| 2017 | $7,963 | $669,700 | $418,600 | $251,100 |
| 2016 | $7,761 | $672,500 | $418,600 | $253,900 |
| 2015 | $7,593 | $672,500 | $418,600 | $253,900 |
| 2014 | $7,346 | $631,100 | $380,600 | $250,500 |
Source: Public Records
Map
Nearby Homes
- 556 Webster St
- 445 Hillside Ave
- 3 Crescent Rd
- 190 Brookline St
- 400 Hunnewell St Unit 103
- 36 Davenport Rd
- 379 Hunnewell St Unit 379
- 9 Jayne Rd
- 143 Hunting Rd
- 7 Avery St
- 23 Cheney St
- 332 Hillcrest Rd
- 40 Otis St Unit L
- 34 Pershing Rd
- 42 Otis St Unit R
- 35 Andrea Cir
- 62 Washington Ave
- 62 Evelyn Rd
- 154 Warren St
- 26 Pinewood Rd
- 9 Thorpe Rd
- 9 Thorpe Rd Unit 9
- 29 Thorpe Rd
- 14 Thorpe Rd
- 14 Thorpe Rd Unit 1
- 33 Manning St
- 28 Thorpe Rd
- 31 Thorpe Rd Unit 109
- 31 Thorpe Rd Unit 211
- 31 Thorpe Rd Unit 210
- 31 Thorpe Rd Unit 207
- 31 Thorpe Rd Unit 206
- 31 Thorpe Rd Unit 205
- 31 Thorpe Rd Unit 204
- 31 Thorpe Rd Unit 203
- 31 Thorpe Rd Unit 202
- 31 Thorpe Rd Unit 111
- 31 Thorpe Rd Unit 110
- 31 Thorpe Rd Unit 108
- 31 Thorpe Rd Unit 107