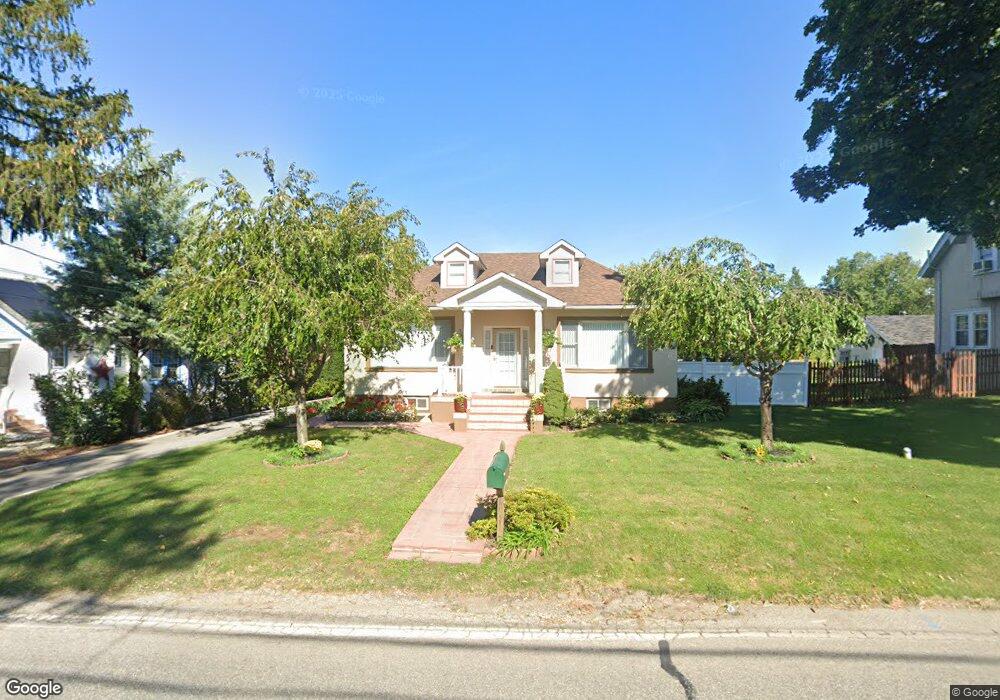
230 Crooked Ln King of Prussia, PA 19406
Estimated Value: $391,000 - $524,000
3
Beds
2
Baths
1,814
Sq Ft
$255/Sq Ft
Est. Value
About This Home
This home is located at 230 Crooked Ln, King of Prussia, PA 19406 and is currently estimated at $463,215, approximately $255 per square foot. 230 Crooked Ln is a home located in Montgomery County with nearby schools including Candlebrook Elementary School, Upper Merion Middle School, and Upper Merion High School.
Ownership History
Date
Name
Owned For
Owner Type
Purchase Details
Closed on
Nov 23, 2009
Sold by
Maj Kryzystof M and Maj Genowefa
Bought by
Maj Kryzstof M and Maj Genowefa
Current Estimated Value
Purchase Details
Closed on
Nov 16, 2009
Sold by
Maj Krzysztof M
Bought by
Maj Genowesa and Maj Krzysztof M
Purchase Details
Closed on
Oct 14, 2003
Sold by
Aryne Nisar
Bought by
Maj Krzysztof M
Home Financials for this Owner
Home Financials are based on the most recent Mortgage that was taken out on this home.
Original Mortgage
$145,000
Interest Rate
6.01%
Purchase Details
Closed on
Dec 20, 2000
Sold by
Farooq Akhtar
Bought by
Aryne Nisar
Purchase Details
Closed on
Dec 5, 2000
Sold by
Faroog Sabah
Bought by
Farooq Akhtar
Purchase Details
Closed on
Aug 27, 1999
Sold by
Falconiero Ada H
Bought by
Faroog Sabah
Create a Home Valuation Report for This Property
The Home Valuation Report is an in-depth analysis detailing your home's value as well as a comparison with similar homes in the area
Home Values in the Area
Average Home Value in this Area
Purchase History
| Date | Buyer | Sale Price | Title Company |
|---|---|---|---|
| Maj Kryzstof M | -- | None Available | |
| Maj Genowesa | -- | None Available | |
| Maj Krzysztof M | $185,000 | -- | |
| Aryne Nisar | -- | -- | |
| Farooq Akhtar | -- | -- | |
| Faroog Sabah | $143,000 | -- |
Source: Public Records
Mortgage History
| Date | Status | Borrower | Loan Amount |
|---|---|---|---|
| Previous Owner | Maj Krzysztof M | $145,000 |
Source: Public Records
Tax History Compared to Growth
Tax History
| Year | Tax Paid | Tax Assessment Tax Assessment Total Assessment is a certain percentage of the fair market value that is determined by local assessors to be the total taxable value of land and additions on the property. | Land | Improvement |
|---|---|---|---|---|
| 2025 | $4,403 | $142,870 | -- | -- |
| 2024 | $4,403 | $142,870 | -- | -- |
| 2023 | $4,247 | $142,870 | $0 | $0 |
| 2022 | $4,065 | $142,870 | $0 | $0 |
| 2021 | $3,939 | $142,870 | $0 | $0 |
| 2020 | $3,764 | $142,870 | $0 | $0 |
| 2019 | $3,700 | $142,870 | $0 | $0 |
| 2018 | $3,700 | $142,870 | $0 | $0 |
| 2017 | $3,567 | $142,870 | $0 | $0 |
| 2016 | $3,511 | $142,870 | $0 | $0 |
| 2015 | $3,381 | $142,870 | $0 | $0 |
| 2014 | $3,381 | $139,170 | $55,050 | $84,120 |
Source: Public Records
Map
Nearby Homes
- 318 Manor Ln Unit 10
- 432 Crooked Ln
- 634 Coates Ln
- 832 Bush St
- 34 7th St
- 205 8th St
- 107 Mahogany Ln
- Penwyn Elite Plan at Stonebrook at Upper Merion - Townes Collection
- Lanfair Plan at Stonebrook at Upper Merion - Townes Collection
- Wyndale Elite Plan at Stonebrook at Upper Merion - Townes Collection
- Carisbrooke Elite Plan at Stonebrook at Upper Merion - Townes Collection
- Brentford Elite Plan at Stonebrook at Upper Merion - Townes Collection
- Avonwood Elite Plan at Stonebrook at Upper Merion - Townes Collection
- Brentford Plan at Stonebrook at Upper Merion - Townes Collection
- Carisbrooke Plan at Stonebrook at Upper Merion - Townes Collection
- 124 7th St
- 615 Green St
- 112 Ivy Ln
- 315 Aspen Way Unit HS 163- CARISBROOKE
- 313 Aspen Way
- 224 Crooked Ln
- 234 Crooked Ln
- 222 Crooked Ln
- 263 Crooked Ln
- 220 Charles St
- 220 Crooked Ln
- 227 Crooked Ln
- 223 Crooked Ln
- 242 Crooked Ln
- 231 Crooked Ln
- 308 Manor Ln Unit 5
- 310 Manor Ln Unit 6
- 306 Manor Ln Unit 4
- 235 Crooked Ln
- 219 Crooked Ln
- 214 Charles St
- 219 Charles St
- 304 Manor Ln Unit 3
- 218 Crooked Ln
- 312 Manor Ln Unit 7