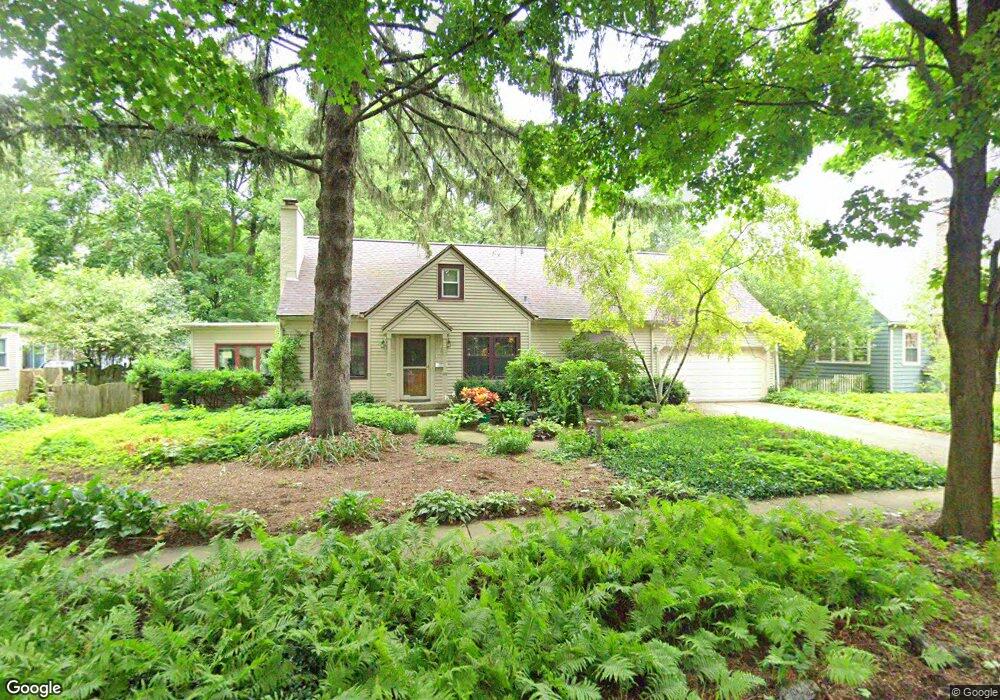
230 Florence Ct Libertyville, IL 60048
South Libertyville NeighborhoodEstimated Value: $587,000 - $622,000
--
Bed
2
Baths
1,893
Sq Ft
$321/Sq Ft
Est. Value
About This Home
This home is located at 230 Florence Ct, Libertyville, IL 60048 and is currently estimated at $606,855, approximately $320 per square foot. 230 Florence Ct is a home located in Lake County with nearby schools including Rockland Elementary School, Highland Middle School, and Libertyville High School.
Ownership History
Date
Name
Owned For
Owner Type
Purchase Details
Closed on
Apr 12, 2007
Sold by
Everitt Elizabeth
Bought by
Everitt Elizabeth A
Current Estimated Value
Purchase Details
Closed on
Nov 7, 2003
Sold by
Stehley Guy
Bought by
Everitt Elizabeth
Purchase Details
Closed on
Oct 31, 2001
Sold by
Declar Baness Patricia L and Declar Patricia Sweeney Baness
Bought by
Stehley Guy A and Everitt Elizabeth A
Home Financials for this Owner
Home Financials are based on the most recent Mortgage that was taken out on this home.
Original Mortgage
$275,000
Interest Rate
6.62%
Purchase Details
Closed on
Feb 3, 1995
Sold by
Baness Patricia L
Bought by
Baness Patricia L
Purchase Details
Closed on
Dec 30, 1993
Sold by
Fredericks Kurt D and Fredericks Lynn A
Bought by
Baness Thomas C and Baness Patricia L
Home Financials for this Owner
Home Financials are based on the most recent Mortgage that was taken out on this home.
Original Mortgage
$150,000
Interest Rate
7.16%
Create a Home Valuation Report for This Property
The Home Valuation Report is an in-depth analysis detailing your home's value as well as a comparison with similar homes in the area
Home Values in the Area
Average Home Value in this Area
Purchase History
| Date | Buyer | Sale Price | Title Company |
|---|---|---|---|
| Everitt Elizabeth A | -- | None Available | |
| Everitt Elizabeth | -- | -- | |
| Stehley Guy A | $360,000 | -- | |
| Baness Patricia L | -- | -- | |
| Baness Thomas C | $169,333 | Chicago Title Insurance Co |
Source: Public Records
Mortgage History
| Date | Status | Borrower | Loan Amount |
|---|---|---|---|
| Previous Owner | Stehley Guy A | $275,000 | |
| Previous Owner | Baness Thomas C | $150,000 | |
| Closed | Stehley Guy A | $67,000 |
Source: Public Records
Tax History Compared to Growth
Tax History
| Year | Tax Paid | Tax Assessment Tax Assessment Total Assessment is a certain percentage of the fair market value that is determined by local assessors to be the total taxable value of land and additions on the property. | Land | Improvement |
|---|---|---|---|---|
| 2024 | $10,923 | $164,403 | $96,940 | $67,463 |
| 2023 | $8,931 | $151,636 | $89,412 | $62,224 |
| 2022 | $8,931 | $122,675 | $85,940 | $36,735 |
| 2021 | $10,027 | $133,320 | $84,090 | $49,230 |
| 2020 | $11,794 | $158,894 | $87,953 | $70,941 |
| 2019 | $11,501 | $157,383 | $87,117 | $70,266 |
| 2018 | $7,078 | $161,726 | $86,398 | $75,328 |
| 2017 | $11,279 | $156,620 | $83,670 | $72,950 |
| 2016 | $10,905 | $148,498 | $79,331 | $69,167 |
| 2015 | $10,806 | $138,796 | $74,148 | $64,648 |
| 2014 | $10,241 | $127,975 | $68,367 | $59,608 |
| 2012 | $9,889 | $130,390 | $69,657 | $60,733 |
Source: Public Records
Map
Nearby Homes
- 308 Mckinley Ave
- 1754 Glenmore Rd
- 212 Elm Ct
- 551 W Park Ave Unit E
- 423 Ames St
- 426 S Milwaukee Ave
- 0 Ames St
- 505 Lange Ct
- 420 W Cook Ave
- 217 E Church St
- 112 3rd St
- 121 4th St
- 533 Drake St
- 401 S 4th Ave
- 601 Broadway St
- 224 Newberry Ave
- 700 E Sunnyside Ave
- 747 Garfield Ave Unit C
- 777 Garfield Ave Unit A
- 851 Garfield Ave Unit C
- 234 Florence Ct
- 224 Florence Ct
- 236 Florence Ct
- 220 Florence Ct
- 242 Florence Ct
- 234 Mckinley Ave
- 304 Mckinley Ave
- 304 Mckinley Ave Unit 304 McKinley Ave. -
- 224 Mckinley Ave
- 312 Mckinley Ave
- 305 W Park Ave
- 305 W Park Ave Unit 2
- 220 Mckinley Ave
- 311 W Park Ave
- 311 W Park Ave Unit 1
- 131 S Stewart Ave
- 221 W Park Ave
- 127 S Stewart Ave
- 301 W Park Ave Unit 2
- 301 W Park Ave