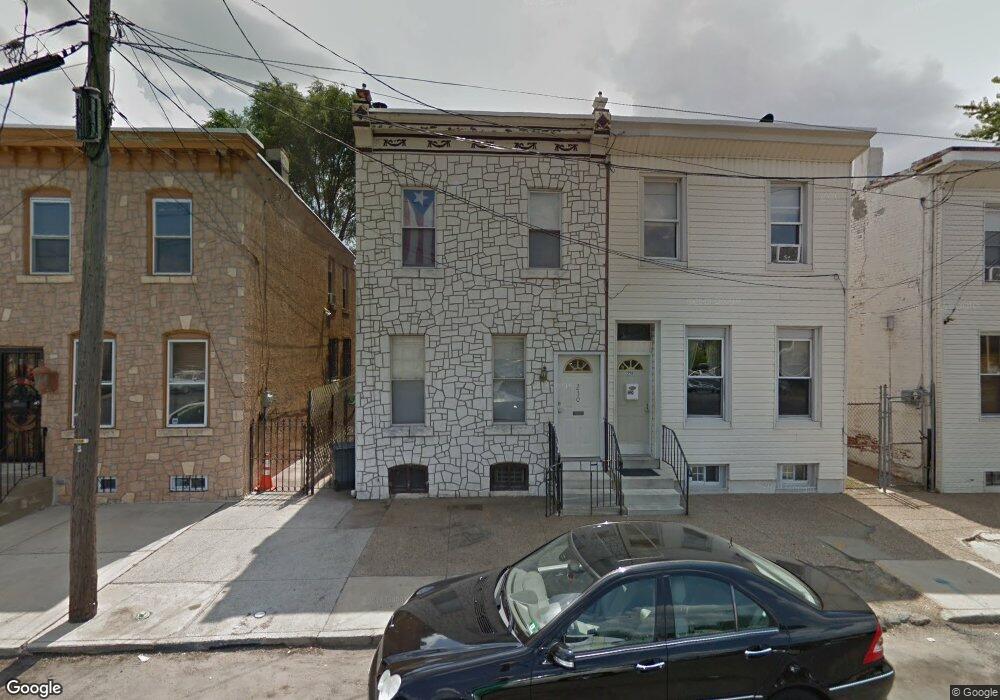
230 Main St Camden, NJ 08102
North Camden NeighborhoodEstimated Value: $162,742 - $225,000
3
Beds
2
Baths
1,472
Sq Ft
$131/Sq Ft
Est. Value
About This Home
This home is located at 230 Main St, Camden, NJ 08102 and is currently estimated at $192,436, approximately $130 per square foot. 230 Main St is a home located in Camden County with nearby schools including Cooper's Poynt Elementary School, Eastside High School, and Leap Academy University Charter School.
Ownership History
Date
Name
Owned For
Owner Type
Purchase Details
Closed on
Jun 27, 2017
Sold by
Trinidad Martha
Bought by
Ayoub Jack
Current Estimated Value
Purchase Details
Closed on
Jun 4, 2012
Sold by
Trinidad Martha and Trinidad Santiago
Bought by
Trinidad Martha
Purchase Details
Closed on
Sep 28, 2010
Sold by
Santiago Margaret
Bought by
Trinidad Martha and Trinidad Santiago
Purchase Details
Closed on
Dec 1, 1999
Sold by
Mumman Paul F
Bought by
Santiago Pedro S
Create a Home Valuation Report for This Property
The Home Valuation Report is an in-depth analysis detailing your home's value as well as a comparison with similar homes in the area
Home Values in the Area
Average Home Value in this Area
Purchase History
| Date | Buyer | Sale Price | Title Company |
|---|---|---|---|
| Ayoub Jack | $70,000 | Surety Title Co | |
| Trinidad Martha | -- | None Available | |
| Trinidad Martha | $55,500 | -- | |
| Santiago Pedro S | $10,000 | -- |
Source: Public Records
Tax History Compared to Growth
Tax History
| Year | Tax Paid | Tax Assessment Tax Assessment Total Assessment is a certain percentage of the fair market value that is determined by local assessors to be the total taxable value of land and additions on the property. | Land | Improvement |
|---|---|---|---|---|
| 2025 | $1,772 | $50,000 | $10,600 | $39,400 |
| 2024 | $1,713 | $50,000 | $10,600 | $39,400 |
| 2023 | $1,713 | $50,000 | $10,600 | $39,400 |
| 2022 | $1,681 | $50,000 | $10,600 | $39,400 |
| 2021 | $1,675 | $50,000 | $10,600 | $39,400 |
| 2020 | $1,590 | $50,000 | $10,600 | $39,400 |
| 2019 | $1,523 | $50,000 | $10,600 | $39,400 |
| 2018 | $1,515 | $50,000 | $10,600 | $39,400 |
| 2017 | $1,478 | $50,000 | $10,600 | $39,400 |
| 2016 | $1,431 | $50,000 | $10,600 | $39,400 |
| 2015 | $1,377 | $50,000 | $10,600 | $39,400 |
| 2014 | $1,344 | $50,000 | $10,600 | $39,400 |
Source: Public Records
Map
Nearby Homes