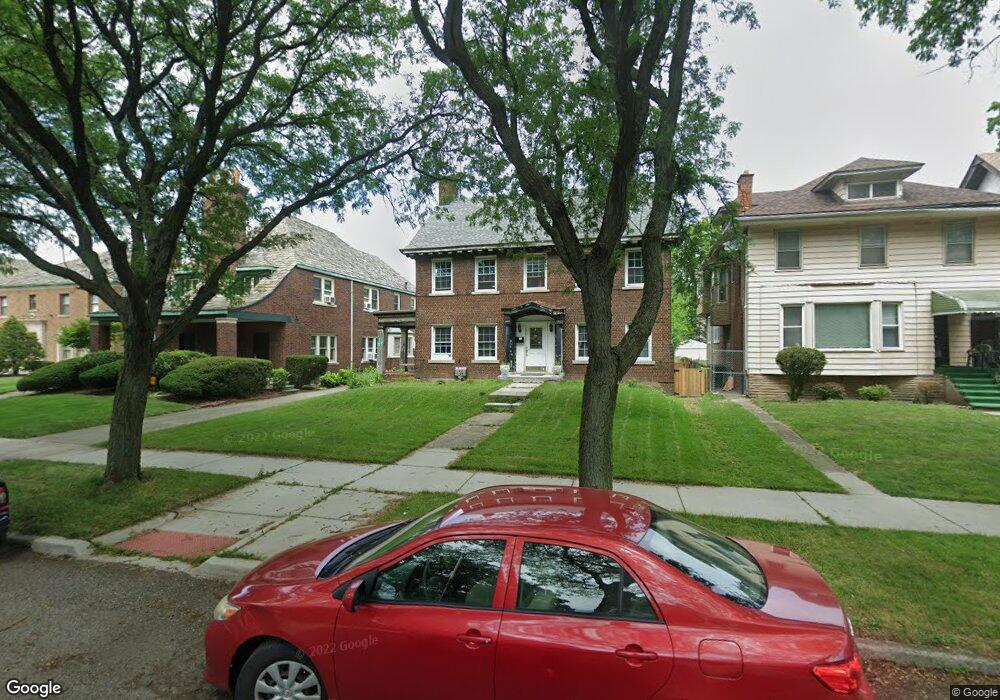
2300 N La Salle Gardens Detroit, MI 48206
LaSalle Gardens NeighborhoodEstimated Value: $196,000 - $371,000
--
Bed
3
Baths
2,146
Sq Ft
$145/Sq Ft
Est. Value
About This Home
This home is located at 2300 N La Salle Gardens, Detroit, MI 48206 and is currently estimated at $310,199, approximately $144 per square foot. 2300 N La Salle Gardens is a home located in Wayne County with nearby schools including Thirkell Elementary School, Charles L. Spain Elementary-Middle School, and Edward 'Duke' Ellington Conservatory of Music and Art.
Ownership History
Date
Name
Owned For
Owner Type
Purchase Details
Closed on
May 6, 2025
Sold by
Wisok Adrienne
Bought by
Gao David
Current Estimated Value
Purchase Details
Closed on
Aug 5, 2010
Sold by
Mla Inc
Bought by
Thompson Jeanetta and Thompson Marcus
Purchase Details
Closed on
May 21, 2008
Sold by
Priority Investment Llc
Bought by
Mla Inc
Purchase Details
Closed on
Jan 24, 2007
Sold by
Ellison Brian
Bought by
Priority Investment Llc
Purchase Details
Closed on
Jun 7, 2006
Sold by
Matthews Carolyn
Bought by
Wachovia Bank Na and Long Beach Mortgage Loan Trust 2002-2
Purchase Details
Closed on
Feb 9, 2005
Sold by
Matthews Carolyn
Bought by
Wachovia Bank Na and Long Beach Mortgage Loan Trust 2002-2
Purchase Details
Closed on
Mar 15, 2002
Sold by
Emerson William F
Bought by
Matthews Carolyn
Create a Home Valuation Report for This Property
The Home Valuation Report is an in-depth analysis detailing your home's value as well as a comparison with similar homes in the area
Home Values in the Area
Average Home Value in this Area
Purchase History
| Date | Buyer | Sale Price | Title Company |
|---|---|---|---|
| Gao David | -- | None Listed On Document | |
| Gao David | -- | None Listed On Document | |
| Thompson Jeanetta | $5,000 | None Available | |
| Mla Inc | -- | None Available | |
| Priority Investment Llc | -- | None Available | |
| Wachovia Bank Na | $172,142 | None Available | |
| Wachovia Bank Na | $143,776 | -- | |
| Matthews Carolyn | $165,000 | Commonwealth Land Title |
Source: Public Records
Tax History Compared to Growth
Tax History
| Year | Tax Paid | Tax Assessment Tax Assessment Total Assessment is a certain percentage of the fair market value that is determined by local assessors to be the total taxable value of land and additions on the property. | Land | Improvement |
|---|---|---|---|---|
| 2025 | $1,057 | $33,700 | $0 | $0 |
| 2024 | $1,057 | $27,500 | $0 | $0 |
| 2023 | $1,024 | $22,400 | $0 | $0 |
| 2022 | $1,142 | $18,000 | $0 | $0 |
| 2021 | $1,462 | $14,000 | $0 | $0 |
| 2020 | $1,079 | $16,600 | $0 | $0 |
| 2019 | $1,063 | $13,200 | $0 | $0 |
| 2018 | $912 | $11,600 | $0 | $0 |
| 2017 | $212 | $11,400 | $0 | $0 |
| 2016 | $1,026 | $22,600 | $0 | $0 |
| 2015 | $1,170 | $11,700 | $0 | $0 |
| 2013 | $1,628 | $16,279 | $0 | $0 |
| 2010 | -- | $23,324 | $1,479 | $21,845 |
Source: Public Records
Map
Nearby Homes
- 2280 Virginia Park St
- 2091 Seward St
- 2081 Virginia Park St
- 2025 W Euclid St
- 2237 W Philadelphia St
- 2533 Virginia Park St
- 2518 N La Salle Gardens
- 2472 W Euclid St
- 2247 W Philadelphia St
- 2225 W Philadelphia St
- 2513 W Euclid St
- 1975 Virginia Park St
- 2270 W Philadelphia St
- 2552 N La Salle Gardens
- 8604 La Salle Blvd
- 2233 Lamothe St
- 7759 Rosa Parks Blvd
- 7435 La Salle Blvd
- 2202 Lothrop St
- 7404 14th St
- 2290 N La Salle Gardens
- 2310 N N La Salle Gardens
- 2274 N La Salle Gardens
- 2310 N La Salle Gardens
- 2297 Virginia Park St
- 2281 Virginia Park St
- 2320 N La Salle Gardens
- 2264 N La Salle Gardens
- 8100 La Salle Blvd
- 8146 La Salle Blvd
- 7780 La Salle Blvd
- 2291 Virginia Park St
- 8150 La Salle Blvd
- 2273 Virginia Park St
- 2261 N La Salle Gardens
- 2243 Virginia Park St
- 2246 N La Salle Gardens
- 7764 La Salle Blvd
- 8162 La Salle Blvd
- 2253 N La Salle Gardens