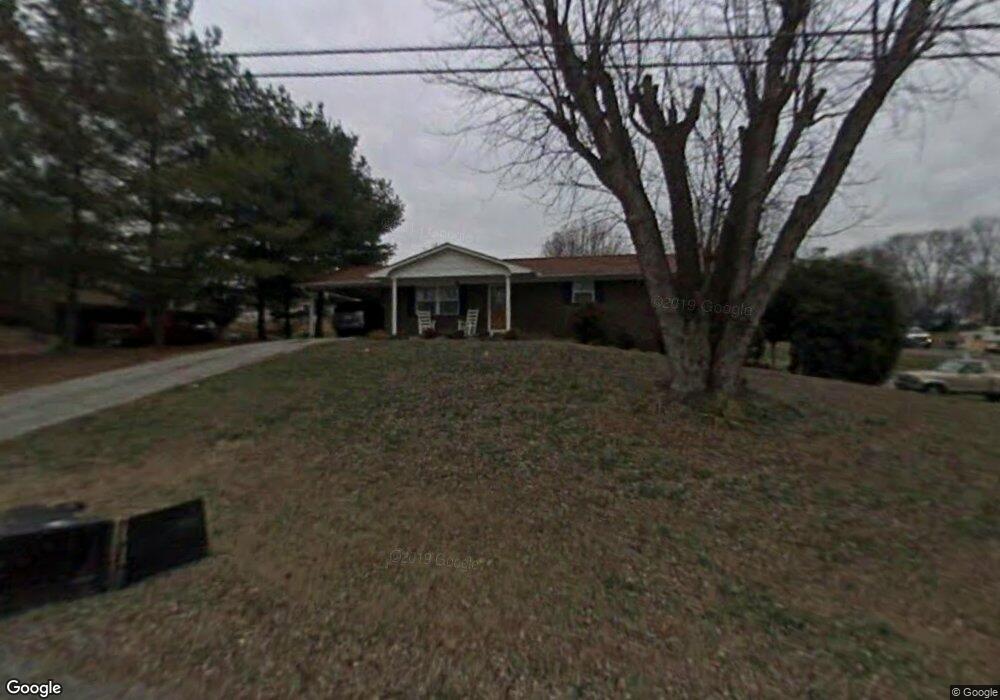
2305 Herron Dr Morristown, TN 37813
Estimated Value: $178,000 - $274,000
--
Bed
2
Baths
1,175
Sq Ft
$196/Sq Ft
Est. Value
About This Home
This home is located at 2305 Herron Dr, Morristown, TN 37813 and is currently estimated at $230,481, approximately $196 per square foot. 2305 Herron Dr is a home located in Hamblen County with nearby schools including Union Heights Elementary School, East Ridge Middle School, and Morristown East High School.
Ownership History
Date
Name
Owned For
Owner Type
Purchase Details
Closed on
May 22, 2023
Sold by
Denise Tiffanie N
Bought by
Mitchell James S and Mitchell Allison F
Current Estimated Value
Purchase Details
Closed on
Aug 20, 2020
Sold by
Jones John L and Jones Pon Z
Bought by
Denise Tiffanie N and Vandervere Joshua
Home Financials for this Owner
Home Financials are based on the most recent Mortgage that was taken out on this home.
Original Mortgage
$143,434
Interest Rate
3%
Mortgage Type
New Conventional
Purchase Details
Closed on
Jan 21, 2004
Sold by
Jones Julia E
Bought by
Jones John L
Home Financials for this Owner
Home Financials are based on the most recent Mortgage that was taken out on this home.
Original Mortgage
$51,500
Interest Rate
5.75%
Purchase Details
Closed on
Jun 10, 1991
Bought by
Jones Julia E Burnett
Purchase Details
Closed on
Jul 9, 1976
Bought by
Burnett Harry J
Purchase Details
Closed on
Feb 9, 1971
Bought by
Burnett Harry J and Burnett Peggy
Create a Home Valuation Report for This Property
The Home Valuation Report is an in-depth analysis detailing your home's value as well as a comparison with similar homes in the area
Home Values in the Area
Average Home Value in this Area
Purchase History
| Date | Buyer | Sale Price | Title Company |
|---|---|---|---|
| Mitchell James S | $146,057 | None Listed On Document | |
| Denise Tiffanie N | $142,000 | None Available | |
| Jones John L | $69,900 | -- | |
| Jones Julia E Burnett | -- | -- | |
| Burnett Harry J | -- | -- | |
| Burnett Harry J | $21,600 | -- |
Source: Public Records
Mortgage History
| Date | Status | Borrower | Loan Amount |
|---|---|---|---|
| Previous Owner | Denise Tiffanie N | $143,434 | |
| Previous Owner | Burnett Harry J | $51,500 |
Source: Public Records
Tax History Compared to Growth
Tax History
| Year | Tax Paid | Tax Assessment Tax Assessment Total Assessment is a certain percentage of the fair market value that is determined by local assessors to be the total taxable value of land and additions on the property. | Land | Improvement |
|---|---|---|---|---|
| 2024 | $565 | $28,675 | $4,025 | $24,650 |
| 2023 | $565 | $28,675 | $0 | $0 |
| 2022 | $565 | $28,675 | $4,025 | $24,650 |
| 2021 | $565 | $28,675 | $4,025 | $24,650 |
| 2020 | $548 | $28,675 | $4,025 | $24,650 |
| 2019 | $532 | $24,975 | $3,900 | $21,075 |
| 2018 | $532 | $24,975 | $3,900 | $21,075 |
| 2017 | $532 | $24,975 | $3,900 | $21,075 |
| 2016 | $497 | $24,975 | $3,900 | $21,075 |
| 2015 | $462 | $24,975 | $3,900 | $21,075 |
| 2014 | -- | $24,975 | $3,900 | $21,075 |
| 2013 | -- | $26,475 | $0 | $0 |
Source: Public Records
Map
Nearby Homes
- 2285 Herron Dr
- 2350 Raritan Dr
- 2310 Herron Dr
- 2290 Herron Dr
- 3050 Sugar Maples St
- 2400 Raritan Dr
- 2265 Herron Dr
- 2290 Raritan Dr
- 2270 Herron Dr
- 2430 Raritan Dr
- 2315 Raritan Dr
- 2365 Raritan Dr
- 2217 Herron Dr
- 2395 Raritan Dr
- 2240 Raritan Dr
- 2220 Herron Dr
- 3065 Fish Hatchery Rd
- 3104 Lon Cir
- 3052 Seals Ln
- 2435 Raritan Dr