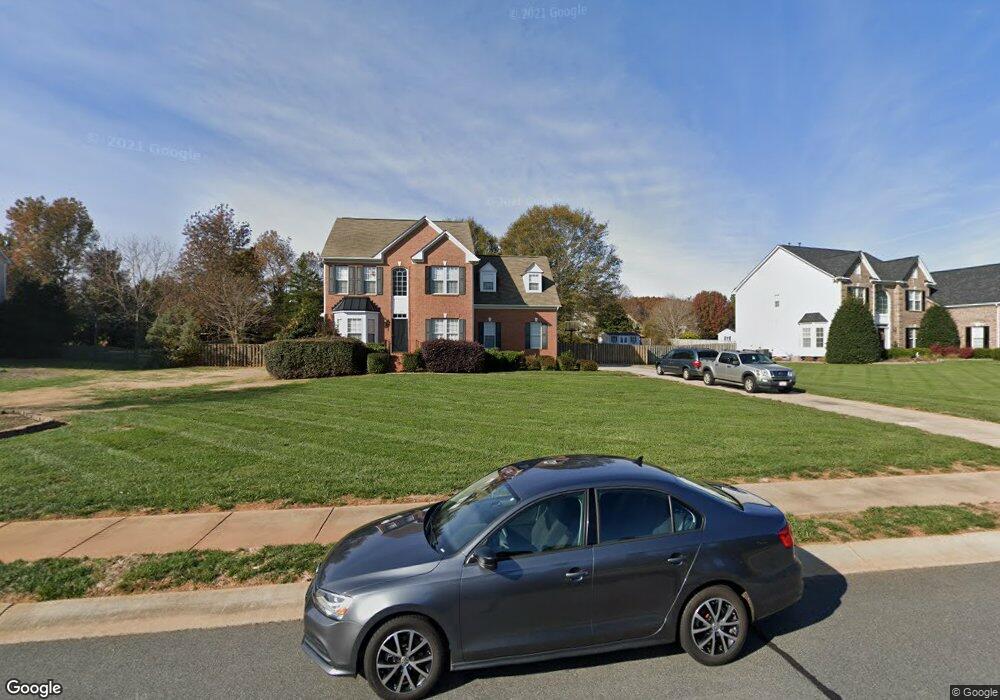
2307 Heath Lake Dr Mint Hill, NC 28227
Estimated Value: $656,000 - $812,000
5
Beds
4
Baths
3,647
Sq Ft
$192/Sq Ft
Est. Value
About This Home
This home is located at 2307 Heath Lake Dr, Mint Hill, NC 28227 and is currently estimated at $699,682, approximately $191 per square foot. 2307 Heath Lake Dr is a home located in Mecklenburg County with nearby schools including Bain Elementary, Mint Hill Middle School, and Independence High.
Ownership History
Date
Name
Owned For
Owner Type
Purchase Details
Closed on
Jun 19, 2008
Sold by
Deseve Kimberly A
Bought by
Merli Robert and Merli Lucy
Current Estimated Value
Home Financials for this Owner
Home Financials are based on the most recent Mortgage that was taken out on this home.
Original Mortgage
$252,000
Outstanding Balance
$161,625
Interest Rate
6.04%
Mortgage Type
Purchase Money Mortgage
Estimated Equity
$538,057
Purchase Details
Closed on
Mar 24, 2008
Sold by
Deseve Michael J and Deseve Kimberly A
Bought by
Deseve Kimberly A
Purchase Details
Closed on
Jun 21, 2006
Sold by
Deseve Michael J and Deseve Kimberly Ann
Bought by
Kroldes Realty Llc
Purchase Details
Closed on
Nov 13, 2002
Sold by
Nvr Inc
Bought by
Deseve Michael J and Deseve Kimberly A
Home Financials for this Owner
Home Financials are based on the most recent Mortgage that was taken out on this home.
Original Mortgage
$175,000
Interest Rate
5.98%
Create a Home Valuation Report for This Property
The Home Valuation Report is an in-depth analysis detailing your home's value as well as a comparison with similar homes in the area
Home Values in the Area
Average Home Value in this Area
Purchase History
| Date | Buyer | Sale Price | Title Company |
|---|---|---|---|
| Merli Robert | $315,000 | None Available | |
| Deseve Kimberly A | -- | None Available | |
| Kroldes Realty Llc | -- | None Available | |
| Deseve Michael J | $277,500 | -- |
Source: Public Records
Mortgage History
| Date | Status | Borrower | Loan Amount |
|---|---|---|---|
| Open | Merli Robert | $252,000 | |
| Previous Owner | Deseve Michael J | $175,000 |
Source: Public Records
Tax History Compared to Growth
Tax History
| Year | Tax Paid | Tax Assessment Tax Assessment Total Assessment is a certain percentage of the fair market value that is determined by local assessors to be the total taxable value of land and additions on the property. | Land | Improvement |
|---|---|---|---|---|
| 2025 | $3,708 | $516,600 | $100,000 | $416,600 |
| 2024 | $3,708 | $516,600 | $100,000 | $416,600 |
| 2023 | $3,651 | $516,600 | $100,000 | $416,600 |
| 2022 | $3,651 | $414,200 | $75,000 | $339,200 |
| 2021 | $3,651 | $414,200 | $75,000 | $339,200 |
| 2020 | $3,252 | $368,500 | $75,000 | $293,500 |
| 2019 | $3,246 | $368,500 | $75,000 | $293,500 |
| 2018 | $3,223 | $290,500 | $50,000 | $240,500 |
| 2017 | $3,178 | $290,500 | $50,000 | $240,500 |
| 2016 | $3,174 | $290,500 | $50,000 | $240,500 |
| 2015 | $3,171 | $290,500 | $50,000 | $240,500 |
| 2014 | $3,169 | $290,500 | $50,000 | $240,500 |
Source: Public Records
Map
Nearby Homes
- 16713 Grande Vineyards Dr
- 6421 Joli Cheval Ln Unit 9
- 2540 Bain Farm Rd
- 6639 Joli Cheval Ln Unit 4
- 12314 Lawyers Rd
- 7362 Purple Martin Way Unit 24
- 7407 Purple Martin Way Unit 50
- 7407 Purple Martin Way
- 7400 Purple Martin Way Unit 25
- 13418 Castleford Dr
- 13324 Lawyers Rd
- 2336 Salute Blvd
- 6005 Long Stirrup Ln
- 5827 Long Stirrup Ln
- 5926 Long Stirrup Ln
- 13620 Castleford Dr
- 3728 Piaffe Ave
- 3900 Piaffe Ave Unit 92
- 6157 Volte Dr Unit 93
- 4246 Piaffe Ave
- 2315 Heath Lake Dr
- 2223 Heath Lake Dr
- 6710 Heath Glen Dr
- 6634 Heath Glen Dr
- 2323 Heath Lake Dr
- 2217 Heath Lake Dr
- 2308 Heath Lake Dr
- 12605 Early Meadow Way
- 6716 Heath Glen Dr
- 2316 Heath Lake Dr
- 6628 Heath Glen Dr
- 2331 Heath Lake Dr Unit 66
- 2324 Heath Lake Dr
- 2209 Heath Lake Dr
- 6722 Heath Glen Dr
- 12604 Early Meadow Way
- 6618 Heath Glen Dr
- 2330 Heath Lake Dr
- 6707 Heath Glen Dr
- 6631 Heath Glen Dr