231 4th St SE Valley City, ND 58072
Estimated Value: $123,000 - $152,000
3
Beds
2
Baths
1,030
Sq Ft
$136/Sq Ft
Est. Value
About This Home
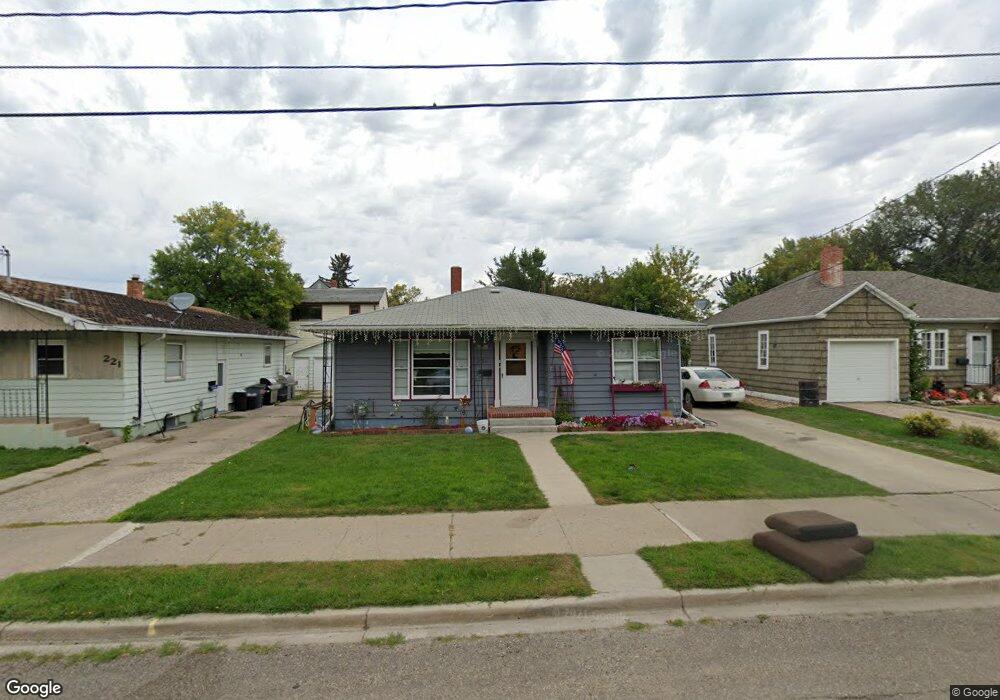
This home is located at 231 4th St SE, Valley City, ND 58072 and is currently estimated at $139,938, approximately $135 per square foot. 231 4th St SE is a home with nearby schools including Jefferson Elementary School, Washington Elementary School, and Valley City Junior High School.
Ownership History
Date
Name
Owned For
Owner Type
Purchase Details
Closed on
Jan 8, 2014
Sold by
Retterath James H and Retterath Gayle
Bought by
Elstrom Amy F
Current Estimated Value
Home Financials for this Owner
Home Financials are based on the most recent Mortgage that was taken out on this home.
Original Mortgage
$56,324
Interest Rate
3.84%
Mortgage Type
Unknown
Purchase Details
Closed on
May 2, 2011
Sold by
Retterath Florence M
Bought by
Retterath James H
Create a Home Valuation Report for This Property
The Home Valuation Report is an in-depth analysis detailing your home's value as well as a comparison with similar homes in the area
Home Values in the Area
Average Home Value in this Area
Purchase History
| Date | Buyer | Sale Price | Title Company |
|---|---|---|---|
| Elstrom Amy F | $70,000 | None Available | |
| Retterath James H | $69,000 | None Available |
Source: Public Records
Mortgage History
| Date | Status | Borrower | Loan Amount |
|---|---|---|---|
| Previous Owner | Elstrom Amy F | $56,324 |
Source: Public Records
Tax History Compared to Growth
Tax History
| Year | Tax Paid | Tax Assessment Tax Assessment Total Assessment is a certain percentage of the fair market value that is determined by local assessors to be the total taxable value of land and additions on the property. | Land | Improvement |
|---|---|---|---|---|
| 2024 | $1,199 | $39,500 | $5,050 | $34,450 |
| 2023 | $1,170 | $38,200 | $5,050 | $33,150 |
| 2022 | $1,138 | $36,600 | $4,400 | $32,200 |
| 2021 | $1,081 | $34,200 | $4,400 | $29,800 |
| 2020 | $1,052 | $34,200 | $4,400 | $29,800 |
| 2019 | $102,782 | $33,900 | $0 | $0 |
| 2018 | $1,007 | $33,500 | $0 | $0 |
| 2017 | $927 | $31,200 | $0 | $0 |
| 2016 | $807 | $31,200 | $0 | $0 |
| 2015 | $756 | $28,900 | $0 | $0 |
| 2014 | -- | $23,050 | $1,900 | $21,150 |
| 2013 | -- | $0 | $0 | $0 |
Source: Public Records
Map
Nearby Homes