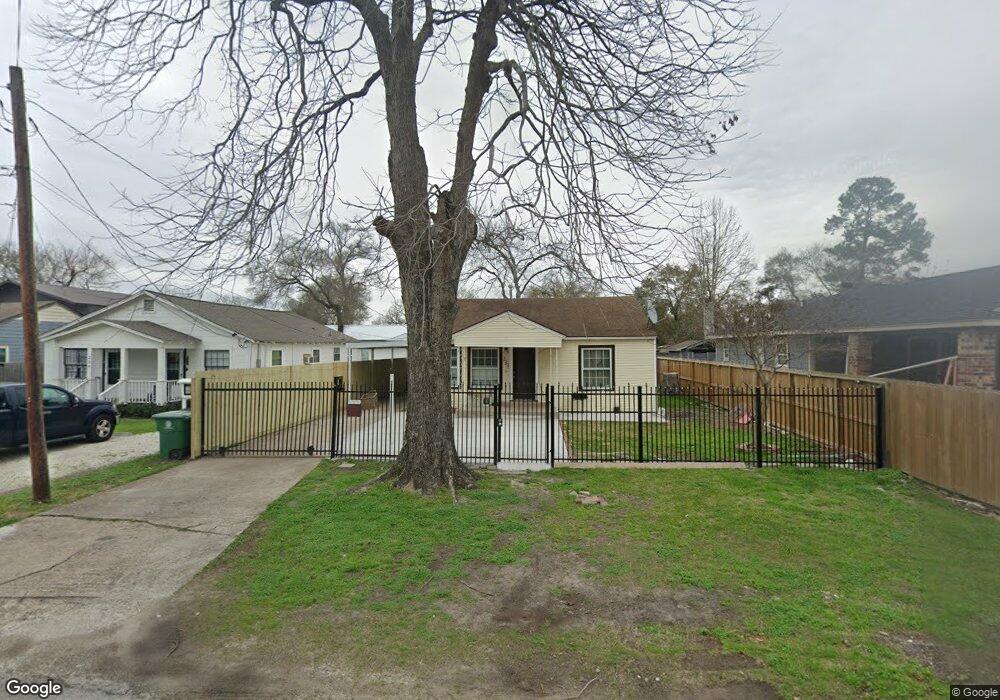
231 Neyland St Houston, TX 77022
Northside-Northline NeighborhoodEstimated Value: $217,760 - $265,000
2
Beds
2
Baths
1,364
Sq Ft
$182/Sq Ft
Est. Value
About This Home
This home is located at 231 Neyland St, Houston, TX 77022 and is currently estimated at $247,690, approximately $181 per square foot. 231 Neyland St is a home located in Harris County with nearby schools including Herrera Elementary School, Burbank Middle School, and Sam Houston Math, Science & Technology Center.
Ownership History
Date
Name
Owned For
Owner Type
Purchase Details
Closed on
Dec 24, 2020
Sold by
Romo Marco A
Bought by
Soto Eleno Cruz and Moralez Nubia Cortez
Current Estimated Value
Home Financials for this Owner
Home Financials are based on the most recent Mortgage that was taken out on this home.
Original Mortgage
$86,060
Outstanding Balance
$61,810
Interest Rate
2.2%
Mortgage Type
New Conventional
Estimated Equity
$185,880
Purchase Details
Closed on
Nov 21, 2006
Sold by
Phillips Pattye A Moore
Bought by
Romo Marco A
Home Financials for this Owner
Home Financials are based on the most recent Mortgage that was taken out on this home.
Original Mortgage
$60,000
Interest Rate
6.37%
Mortgage Type
Purchase Money Mortgage
Create a Home Valuation Report for This Property
The Home Valuation Report is an in-depth analysis detailing your home's value as well as a comparison with similar homes in the area
Home Values in the Area
Average Home Value in this Area
Purchase History
| Date | Buyer | Sale Price | Title Company |
|---|---|---|---|
| Soto Eleno Cruz | -- | None Available | |
| Romo Marco A | -- | Startex 07 Title Company |
Source: Public Records
Mortgage History
| Date | Status | Borrower | Loan Amount |
|---|---|---|---|
| Open | Soto Eleno Cruz | $86,060 | |
| Previous Owner | Romo Marco A | $60,000 |
Source: Public Records
Tax History Compared to Growth
Tax History
| Year | Tax Paid | Tax Assessment Tax Assessment Total Assessment is a certain percentage of the fair market value that is determined by local assessors to be the total taxable value of land and additions on the property. | Land | Improvement |
|---|---|---|---|---|
| 2025 | $4,202 | $178,246 | $103,700 | $74,546 |
| 2024 | $4,202 | $200,823 | $103,700 | $97,123 |
| 2023 | $4,202 | $204,926 | $89,975 | $114,951 |
| 2022 | $3,653 | $165,917 | $67,100 | $98,817 |
| 2021 | $3,373 | $144,720 | $67,100 | $77,620 |
| 2020 | $2,769 | $134,801 | $67,100 | $67,701 |
| 2019 | $2,631 | $122,601 | $54,900 | $67,701 |
| 2018 | $1,621 | $94,512 | $38,125 | $56,387 |
| 2017 | $2,390 | $94,512 | $38,125 | $56,387 |
| 2016 | $2,390 | $94,512 | $38,125 | $56,387 |
| 2015 | $1,522 | $91,805 | $30,500 | $61,305 |
| 2014 | $1,522 | $84,430 | $21,350 | $63,080 |
Source: Public Records
Map
Nearby Homes
- 7111 Bauman Rd
- 249 Basswood St
- 7311 Roswell St
- 7317 Roswell St
- 7315 Roswell St
- 7014 Finn St
- 121-123 Van Molan St
- 164 Wallace St
- 7018 Finn St
- 7015 Roswell St
- 245 Palmyra St
- 105 Oddo St
- 428 Van Molan St
- 65 Neyland St
- 7523 Roswell St
- 7009 Amber St
- 212B Garrotsville St
- 212A Garrotsville St
- 311 & 309 Bennington St
- 136 Theron St
- 233 Neyland St
- 229 Neyland St
- 229 Neyland St Unit A
- 229 Neyland St Unit B
- 229 Neyland St Unit C
- 235 Neyland St
- 227 Neyland St
- 241 Neyland St
- 236 Weisenberger Dr
- 232 Weisenberger Dr Unit 1
- 232 Weisenberger Dr
- 232 Neyland St
- 228 Weisenberger Dr
- 234 Neyland St
- 223 Neyland St
- 243 Neyland St
- 230 Neyland St
- 228 Neyland St
- 238 Neyland St
- 226 Weisenberger Dr