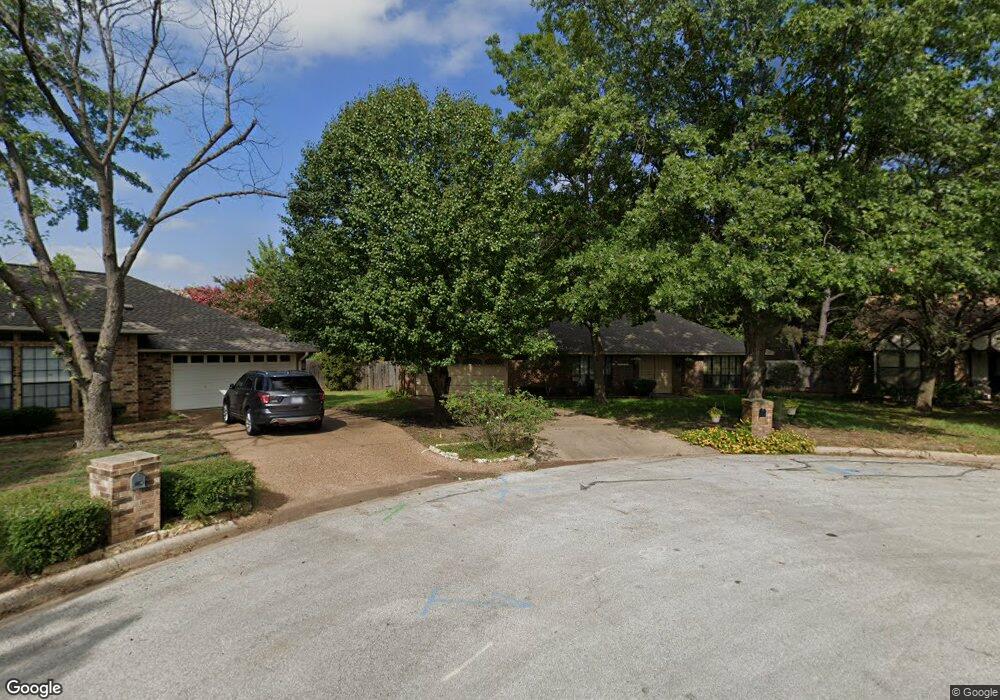
2311 Dove Meadow Ct Grapevine, TX 76051
Estimated Value: $439,870 - $502,000
3
Beds
2
Baths
1,848
Sq Ft
$253/Sq Ft
Est. Value
About This Home
This home is located at 2311 Dove Meadow Ct, Grapevine, TX 76051 and is currently estimated at $467,468, approximately $252 per square foot. 2311 Dove Meadow Ct is a home located in Tarrant County with nearby schools including Dove Elementary School, Grapevine Middle, and Grapevine High School.
Ownership History
Date
Name
Owned For
Owner Type
Purchase Details
Closed on
Dec 10, 2019
Sold by
Lillo Nancy Lee
Bought by
Lillo Nancy Lee and Lillo Living Trust
Current Estimated Value
Purchase Details
Closed on
Jul 18, 2003
Sold by
Waldrop Susan B
Bought by
Lillo Nancy Lee
Home Financials for this Owner
Home Financials are based on the most recent Mortgage that was taken out on this home.
Original Mortgage
$133,520
Outstanding Balance
$56,467
Interest Rate
5.19%
Mortgage Type
Purchase Money Mortgage
Estimated Equity
$411,001
Purchase Details
Closed on
Dec 30, 1993
Sold by
Obriant David Louis and Obriant Sandra Delaine
Bought by
Waldrop Susan B
Home Financials for this Owner
Home Financials are based on the most recent Mortgage that was taken out on this home.
Original Mortgage
$114,690
Interest Rate
7.23%
Mortgage Type
FHA
Purchase Details
Closed on
Oct 26, 1993
Sold by
Obriant Franetta Jean
Bought by
Obriant David Louis
Create a Home Valuation Report for This Property
The Home Valuation Report is an in-depth analysis detailing your home's value as well as a comparison with similar homes in the area
Home Values in the Area
Average Home Value in this Area
Purchase History
| Date | Buyer | Sale Price | Title Company |
|---|---|---|---|
| Lillo Nancy Lee | -- | None Available | |
| Lillo Nancy Lee | -- | Alamo Title Company | |
| Waldrop Susan B | -- | -- | |
| Obriant David Louis | -- | -- |
Source: Public Records
Mortgage History
| Date | Status | Borrower | Loan Amount |
|---|---|---|---|
| Open | Lillo Nancy Lee | $133,520 | |
| Previous Owner | Waldrop Susan B | $114,690 |
Source: Public Records
Tax History Compared to Growth
Tax History
| Year | Tax Paid | Tax Assessment Tax Assessment Total Assessment is a certain percentage of the fair market value that is determined by local assessors to be the total taxable value of land and additions on the property. | Land | Improvement |
|---|---|---|---|---|
| 2025 | $1,491 | $309,500 | $75,000 | $234,500 |
| 2024 | $1,491 | $383,050 | $75,000 | $308,050 |
| 2023 | $5,585 | $380,639 | $70,000 | $310,639 |
| 2022 | $6,001 | $302,884 | $50,000 | $252,884 |
| 2021 | $6,631 | $304,974 | $50,000 | $254,974 |
| 2020 | $6,249 | $307,064 | $50,000 | $257,064 |
| 2019 | $5,890 | $309,153 | $50,000 | $259,153 |
| 2018 | $1,396 | $234,788 | $50,000 | $184,788 |
| 2017 | $4,936 | $294,985 | $50,000 | $244,985 |
| 2016 | $4,487 | $260,885 | $50,000 | $210,885 |
| 2015 | $3,731 | $176,400 | $25,000 | $151,400 |
| 2014 | $3,731 | $176,400 | $25,000 | $151,400 |
Source: Public Records
Map
Nearby Homes
- 1650 Hyland Greens Dr
- 1507 Cimarron Trail
- 2211 Sierra Dr
- 2138 Sierra Dr
- 2217 Pecos Dr
- 1092 Rosewood Dr
- 1985 Shorewood Dr
- 1723 Autumn Ridge Ln
- 1916 Everglade Ct
- 831 Simmons Ct
- 1902 Shorewood Dr
- 2804 Stonehurst Dr
- 1024 Woodbriar Dr
- 2092 Holt Way
- 2709 Cobblestone Dr
- 2081 Holt Way
- 1827 Sonnet Dr
- 1641 Choteau Cir
- 6007 Laurel Ln
- 6011 Laurel Ln
- 2308 Dove Meadow Ct
- 2314 Dove Meadow Ct
- 1666 Hyland Greens Dr
- 1670 Hyland Greens Dr
- 1731 Chaparral Ct
- 1725 Chaparral Ct
- 1662 Hyland Greens Dr
- 1719 Chaparral Ct
- 1737 Chaparral Ct
- 2318 Dove Meadow Ct
- 2304 Dove Meadow Ct
- 1658 Hyland Greens Dr
- 1713 Chaparral Ct
- 1622 Hyland Greens Dr
- 1802 Fairfax Cir
- 1654 Hyland Greens Dr
- 2322 Dove Meadow Ct
- 1618 Hyland Greens Dr
- 1720 Chaparral Ct
- 1801 Chaparral Ct