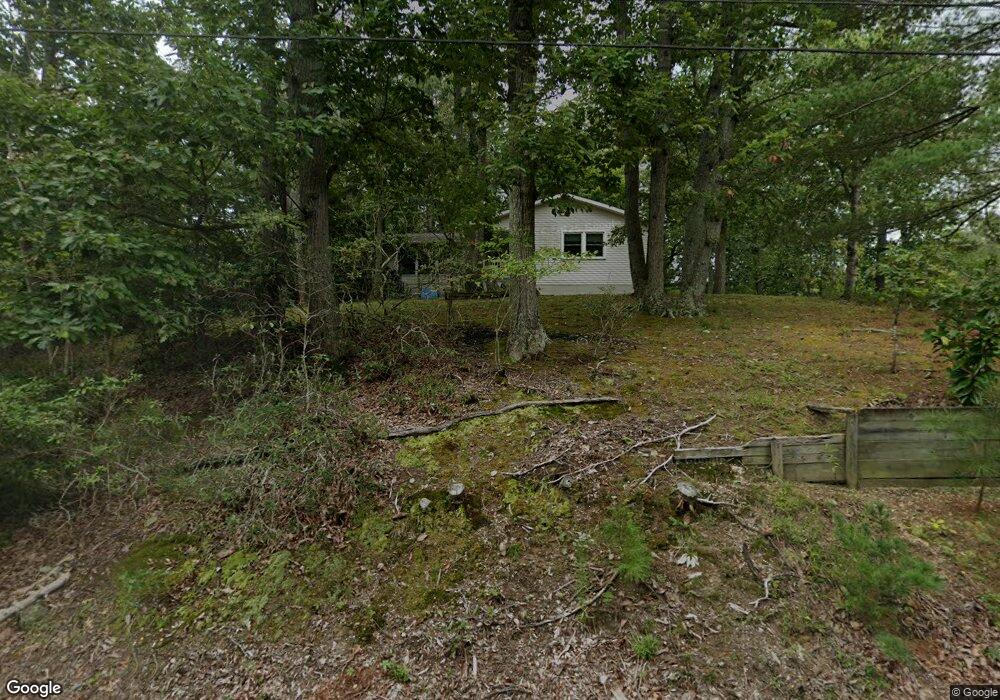
23150 Gunston Dr Lexington Park, MD 20653
Estimated Value: $348,381 - $410,000
--
Bed
3
Baths
1,296
Sq Ft
$291/Sq Ft
Est. Value
About This Home
This home is located at 23150 Gunston Dr, Lexington Park, MD 20653 and is currently estimated at $377,345, approximately $291 per square foot. 23150 Gunston Dr is a home located in St. Mary's County with nearby schools including Town Creek Elementary School, Esperanza Middle School, and Great Mills High School.
Ownership History
Date
Name
Owned For
Owner Type
Purchase Details
Closed on
May 20, 2016
Sold by
Bohanan John L and Bohanan Mary D
Bought by
Carter Andre
Current Estimated Value
Home Financials for this Owner
Home Financials are based on the most recent Mortgage that was taken out on this home.
Original Mortgage
$220,924
Outstanding Balance
$176,385
Interest Rate
3.75%
Mortgage Type
FHA
Estimated Equity
$200,960
Purchase Details
Closed on
Jun 29, 1989
Sold by
Paul Robert William
Bought by
Bohanan John L and Bohanan Mary D
Home Financials for this Owner
Home Financials are based on the most recent Mortgage that was taken out on this home.
Original Mortgage
$120,000
Interest Rate
10.19%
Purchase Details
Closed on
Sep 3, 1980
Sold by
Cox Edwin B
Bought by
Paul Robert William
Home Financials for this Owner
Home Financials are based on the most recent Mortgage that was taken out on this home.
Original Mortgage
$57,710
Interest Rate
12.95%
Create a Home Valuation Report for This Property
The Home Valuation Report is an in-depth analysis detailing your home's value as well as a comparison with similar homes in the area
Home Values in the Area
Average Home Value in this Area
Purchase History
| Date | Buyer | Sale Price | Title Company |
|---|---|---|---|
| Carter Andre | $225,000 | Attorney | |
| Bohanan John L | $130,000 | -- | |
| Paul Robert William | $74,000 | -- |
Source: Public Records
Mortgage History
| Date | Status | Borrower | Loan Amount |
|---|---|---|---|
| Open | Carter Andre | $220,924 | |
| Previous Owner | Bohanan John L | $120,000 | |
| Previous Owner | Paul Robert William | $57,710 |
Source: Public Records
Tax History Compared to Growth
Tax History
| Year | Tax Paid | Tax Assessment Tax Assessment Total Assessment is a certain percentage of the fair market value that is determined by local assessors to be the total taxable value of land and additions on the property. | Land | Improvement |
|---|---|---|---|---|
| 2025 | $3,380 | $309,900 | $0 | $0 |
| 2024 | $3,179 | $291,100 | $0 | $0 |
| 2023 | $2,978 | $272,300 | $102,100 | $170,200 |
| 2022 | $2,939 | $268,833 | $0 | $0 |
| 2021 | $2,901 | $265,367 | $0 | $0 |
| 2020 | $2,862 | $261,900 | $102,100 | $159,800 |
| 2019 | $2,861 | $261,900 | $102,100 | $159,800 |
| 2018 | $2,859 | $261,900 | $102,100 | $159,800 |
| 2017 | $2,872 | $266,500 | $0 | $0 |
| 2016 | -- | $265,833 | $0 | $0 |
| 2015 | -- | $265,167 | $0 | $0 |
| 2014 | $3,082 | $264,500 | $0 | $0 |
Source: Public Records
Map
Nearby Homes
- 23024 Town Creek Dr
- 23164 Mirfield Ln
- 22860 Maple Rd
- Lot 8 Lake Dr
- 45855 W Sunrise Dr
- 45568 Catalina Ln
- 0 Millstone Landing Rd Unit MDSM2016996
- 45462 Westmeath Way Unit K-21
- 45472 Westmeath Way Unit I12
- 45521 Westmeath Way Unit 12
- 22518 Armsworthy Ct
- 23499 Myrtle Point Rd
- 0 Kingston Creek Rd
- 22489 Wainwright Ct
- 45246 Coledorall Ct
- 23294 Esperanza Dr
- 45231 Billy Way
- 22453 Macarthur Blvd
- 45851 N Poteat Ct
- 23531 Myrtle Point Rd
- 23160 Gunston Dr
- 45740 Island Rd
- 45760 Island Rd
- 45770 Island Rd
- 23041 Gunston Dr
- 23047 Gunston Dr
- 23037 Gunston Dr
- 45725 Park Place
- 23012 Boaz St
- 23031 Gunston Dr
- 23053 Gunston Dr
- 45785 King Dr
- 23005 Boaz St
- 23076 Town Creek Dr
- 23024 Gunston Dr
- 45757 Park Place
- 23025 Gunston Dr
- 23070 Town Creek Dr
- 22992 Boaz St
- 23084 Town Creek Dr