Estimated Value: $237,000 - $294,000
3
Beds
1
Bath
1,226
Sq Ft
$207/Sq Ft
Est. Value
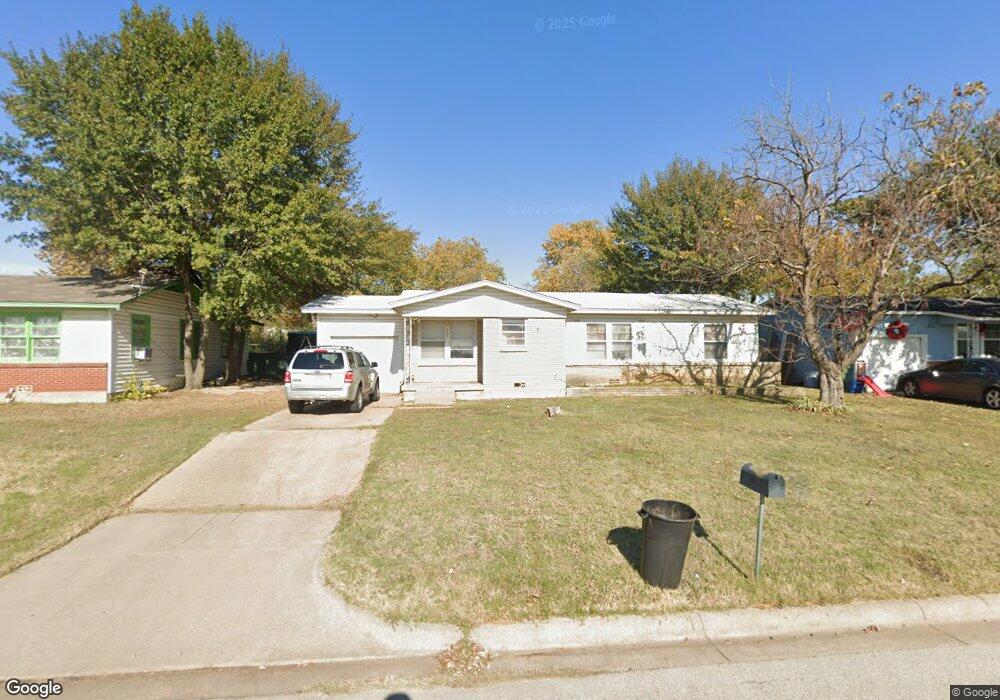
About This Home
This home is located at 232 W Pecan St, Hurst, TX 76053 and is currently estimated at $253,548, approximately $206 per square foot. 232 W Pecan St is a home located in Tarrant County with nearby schools including Harrison Lane Elementary School, Hurst J High School, and L.D. Bell High School.
Ownership History
Date
Name
Owned For
Owner Type
Purchase Details
Closed on
Jun 13, 2008
Sold by
Shelby Anthony Wayne and Hull Tammy Rene Shelby
Bought by
Marshall Dale
Current Estimated Value
Home Financials for this Owner
Home Financials are based on the most recent Mortgage that was taken out on this home.
Original Mortgage
$67,933
Outstanding Balance
$43,659
Interest Rate
6.08%
Mortgage Type
Purchase Money Mortgage
Estimated Equity
$209,889
Create a Home Valuation Report for This Property
The Home Valuation Report is an in-depth analysis detailing your home's value as well as a comparison with similar homes in the area
Home Values in the Area
Average Home Value in this Area
Purchase History
| Date | Buyer | Sale Price | Title Company |
|---|---|---|---|
| Marshall Dale | -- | United Title Of Texas |
Source: Public Records
Mortgage History
| Date | Status | Borrower | Loan Amount |
|---|---|---|---|
| Open | Marshall Dale | $67,933 |
Source: Public Records
Tax History Compared to Growth
Tax History
| Year | Tax Paid | Tax Assessment Tax Assessment Total Assessment is a certain percentage of the fair market value that is determined by local assessors to be the total taxable value of land and additions on the property. | Land | Improvement |
|---|---|---|---|---|
| 2025 | $196 | $231,992 | $50,000 | $181,992 |
| 2024 | $196 | $231,992 | $50,000 | $181,992 |
| 2023 | $3,577 | $213,617 | $30,000 | $183,617 |
| 2022 | $3,738 | $200,532 | $30,000 | $170,532 |
| 2021 | $577 | $163,556 | $30,000 | $133,556 |
| 2020 | $523 | $148,038 | $30,000 | $118,038 |
| 2019 | $484 | $133,146 | $30,000 | $103,146 |
| 2018 | $182 | $122,580 | $17,969 | $104,611 |
| 2017 | $413 | $132,071 | $19,000 | $113,071 |
| 2016 | $376 | $112,386 | $19,000 | $93,386 |
| 2015 | $2,059 | $83,300 | $13,500 | $69,800 |
| 2014 | $2,059 | $93,300 | $13,500 | $79,800 |
Source: Public Records
Map
Nearby Homes