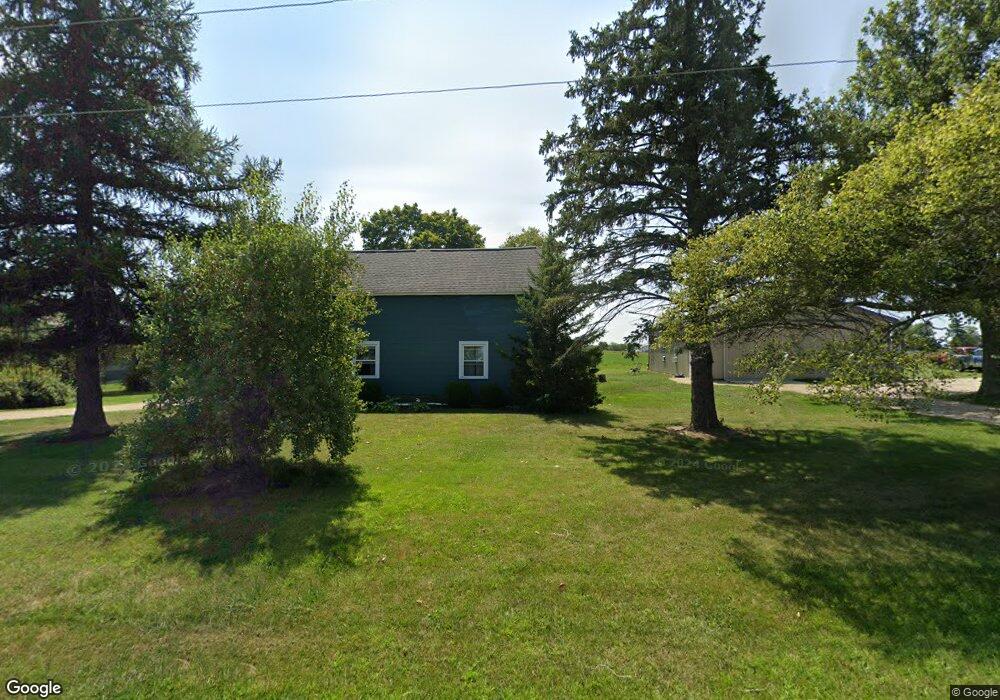
2322 Rockford West Rd Rockford, OH 45882
Estimated Value: $175,265 - $197,000
4
Beds
1
Bath
1,727
Sq Ft
$108/Sq Ft
Est. Value
About This Home
This home is located at 2322 Rockford West Rd, Rockford, OH 45882 and is currently estimated at $186,316, approximately $107 per square foot. 2322 Rockford West Rd is a home located in Mercer County with nearby schools including Parkway Elementary School, Parkway Middle School, and Parkway High School.
Ownership History
Date
Name
Owned For
Owner Type
Purchase Details
Closed on
Mar 25, 2022
Sold by
Eicher Paul F
Bought by
Secaur Seth
Current Estimated Value
Purchase Details
Closed on
Jul 30, 2021
Sold by
Secaur Jeffrey A
Bought by
Secaur Seth
Home Financials for this Owner
Home Financials are based on the most recent Mortgage that was taken out on this home.
Original Mortgage
$75,000
Interest Rate
2.9%
Mortgage Type
New Conventional
Purchase Details
Closed on
May 14, 2019
Sold by
Bagley Michael R and Bagley Debra L
Bought by
Secaur Jeffrey A
Purchase Details
Closed on
Sep 23, 2016
Sold by
Shock Madge E
Bought by
Bagley Michael R and Bagley Debra L
Purchase Details
Closed on
Nov 30, 2010
Sold by
Hughes Audra
Bought by
Shock Madge E
Purchase Details
Closed on
Aug 16, 2007
Sold by
Shock Max and Shock Dorothy
Bought by
Shock Madge E
Create a Home Valuation Report for This Property
The Home Valuation Report is an in-depth analysis detailing your home's value as well as a comparison with similar homes in the area
Home Values in the Area
Average Home Value in this Area
Purchase History
| Date | Buyer | Sale Price | Title Company |
|---|---|---|---|
| Secaur Seth | -- | White Claire L | |
| Secaur Seth | $93,750 | Liberty Title & Escrow Co | |
| Secaur Jeffrey A | $108,000 | None Available | |
| Bagley Michael R | $60,000 | Attorney | |
| Shock Madge E | -- | Attorney | |
| Shock Madge E | -- | None Available |
Source: Public Records
Mortgage History
| Date | Status | Borrower | Loan Amount |
|---|---|---|---|
| Previous Owner | Secaur Seth | $75,000 |
Source: Public Records
Tax History Compared to Growth
Tax History
| Year | Tax Paid | Tax Assessment Tax Assessment Total Assessment is a certain percentage of the fair market value that is determined by local assessors to be the total taxable value of land and additions on the property. | Land | Improvement |
|---|---|---|---|---|
| 2024 | $1,642 | $48,030 | $6,760 | $41,270 |
| 2023 | $1,642 | $48,030 | $6,760 | $41,270 |
| 2022 | $1,524 | $33,010 | $6,690 | $26,320 |
| 2021 | $951 | $31,960 | $5,640 | $26,320 |
| 2020 | $525 | $24,750 | $5,640 | $19,110 |
| 2019 | $885 | $21,950 | $5,320 | $16,630 |
| 2018 | $863 | $21,950 | $5,320 | $16,630 |
| 2017 | $595 | $21,950 | $5,320 | $16,630 |
| 2016 | $594 | $16,740 | $4,450 | $12,290 |
| 2015 | $588 | $16,740 | $4,450 | $12,290 |
| 2014 | $589 | $16,740 | $4,450 | $12,290 |
| 2013 | $704 | $18,130 | $4,830 | $13,300 |
Source: Public Records
Map
Nearby Homes
- 11164 Erastus Durbin Rd
- 0 Rockford West Rd Unit Lots 14- 28
- 0 Wilson Unit 1037059
- 0 Wilson Unit 306333
- 7957 W Bridge St
- 208 W Pearl St
- 208 Market St
- 12223 Ohio 49
- 18892 Ohio 49
- 200 Sprague St
- 100 Sprague St
- 403 Riley St
- 5062 Mercer van Wert County Line Rd
- 15845 Uus 127
- 0 Mercer van Wert County Line Rd
- 108 S Ball Rd
- 5828 E 150 N
- 9289 Wren Landeck Rd
- 2067 N US Highway 33
- 9155 Us Route 127
- 2322 Rockford Rd W
- 2251 Rockford West Rd
- 2250 Rockford West Rd
- 2350 Rockford Rd W
- 2412 Rockford West Rd
- 2490 Rockford Rd W
- 2490 Rockford West Rd
- 11995 Jordan Rd
- 2116 Rockford West Rd
- 11951 Erastus Durbin Rd
- 1779 Rockford West Rd
- 7410 Rockford Rd W
- 12032 Erastus Durbin Rd
- 12115 Jordan Rd
- 11412 Stover Rd
- 1840 Rockford West Rd