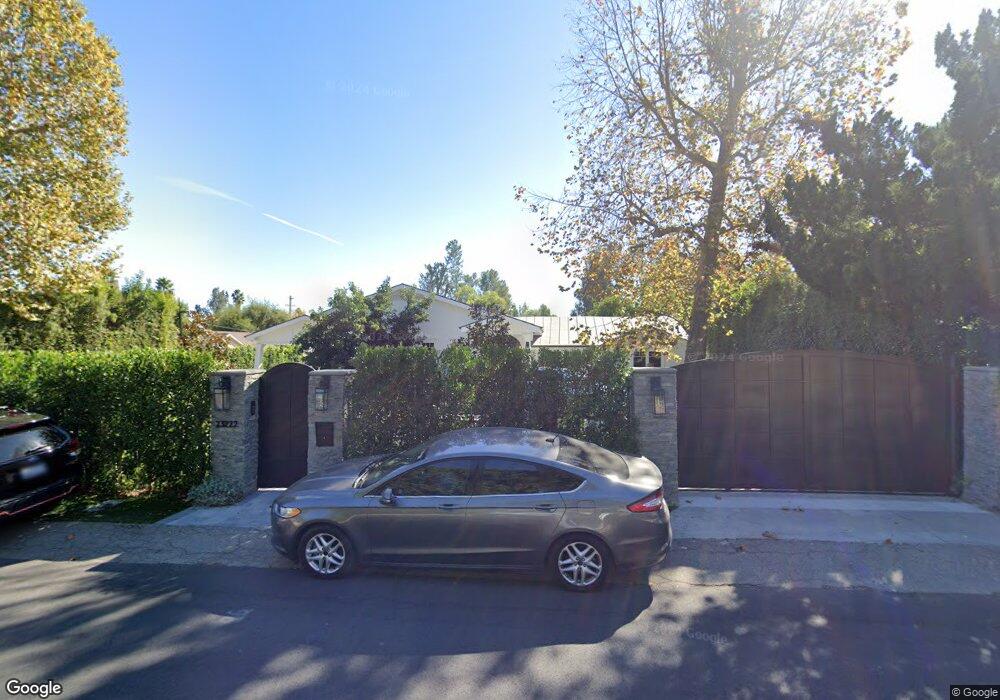
23222 Oxnard St Woodland Hills, CA 91367
Estimated Value: $2,042,000 - $2,283,000
3
Beds
2
Baths
3,764
Sq Ft
$564/Sq Ft
Est. Value
About This Home
This home is located at 23222 Oxnard St, Woodland Hills, CA 91367 and is currently estimated at $2,121,686, approximately $563 per square foot. 23222 Oxnard St is a home located in Los Angeles County with nearby schools including Woodlake Elementary Community Charter, Lockhurst Drive Charter Elementary, and Hamlin Charter Academy.
Ownership History
Date
Name
Owned For
Owner Type
Purchase Details
Closed on
Jul 7, 2011
Sold by
Dupree Gregory Dean
Bought by
Richardson Ryan and Richardson David M
Current Estimated Value
Home Financials for this Owner
Home Financials are based on the most recent Mortgage that was taken out on this home.
Original Mortgage
$547,250
Interest Rate
3.87%
Mortgage Type
Adjustable Rate Mortgage/ARM
Purchase Details
Closed on
Oct 21, 2010
Sold by
Dupree Gregory Dean
Bought by
Dupree Gregory Dean and Beverley Dupree Trust
Purchase Details
Closed on
Aug 28, 2009
Sold by
Nealon Kevin J
Bought by
Nealon Linda M
Purchase Details
Closed on
Oct 11, 2006
Sold by
Nealon Kevin
Bought by
Nealon Linda
Purchase Details
Closed on
Mar 3, 1999
Sold by
Dupree Donald
Bought by
Dupree Donald Gregory and Dupree Beverley Dean
Create a Home Valuation Report for This Property
The Home Valuation Report is an in-depth analysis detailing your home's value as well as a comparison with similar homes in the area
Home Values in the Area
Average Home Value in this Area
Purchase History
| Date | Buyer | Sale Price | Title Company |
|---|---|---|---|
| Richardson Ryan | $730,000 | Fidelity Van Nuys | |
| Dupree Gregory Dean | -- | Accommodation | |
| Nealon Linda M | -- | Accommodation | |
| Nealon Linda | -- | None Available | |
| Dupree Donald Gregory | -- | -- |
Source: Public Records
Mortgage History
| Date | Status | Borrower | Loan Amount |
|---|---|---|---|
| Previous Owner | Richardson Ryan | $547,250 |
Source: Public Records
Tax History Compared to Growth
Tax History
| Year | Tax Paid | Tax Assessment Tax Assessment Total Assessment is a certain percentage of the fair market value that is determined by local assessors to be the total taxable value of land and additions on the property. | Land | Improvement |
|---|---|---|---|---|
| 2025 | $14,299 | $1,141,139 | $366,762 | $774,377 |
| 2024 | $14,134 | $1,118,765 | $359,571 | $759,194 |
| 2023 | $14,063 | $1,113,119 | $442,660 | $670,459 |
| 2022 | $13,423 | $1,091,294 | $433,981 | $657,313 |
| 2021 | $12,959 | $1,052,184 | $338,833 | $713,351 |
| 2020 | $13,084 | $1,041,396 | $335,359 | $706,037 |
| 2019 | $10,574 | $855,099 | $328,784 | $526,315 |
| 2018 | $10,315 | $838,334 | $322,338 | $515,996 |
| 2016 | $9,879 | $805,782 | $309,822 | $495,960 |
| 2015 | $9,736 | $793,680 | $305,169 | $488,511 |
| 2014 | $9,775 | $778,134 | $299,192 | $478,942 |
Source: Public Records
Map
Nearby Homes
- 23201 Oxnard St
- 23116 Califa St
- 23123 Oxnard St
- 23236 Hatteras St
- 23357 Hatteras St
- 23416 Califa St
- 23340 Collins St
- 23346 Collins St
- 6001 Manton Ave
- 23242 Burbank Blvd
- 22900 Hatteras St
- 6227 Glide Ave
- 22924 Erwin St
- 23442 Burbank Blvd
- 6172 Dalecrest Ave
- 23143 Dolorosa St
- 22851 Calvert St
- 22910 Collins St
- 23238 Victory Blvd
- 23367 Friar St
- 23212 Oxnard St
- 23232 Oxnard St
- 23214 W Oxnard St
- 23212 W Oxnard St
- 23202 Oxnard St
- 23242 Oxnard St
- 23207 Califa St
- 23213 Califa St
- 23201 Califa St
- 23213 Oxnard St
- 23225 Oxnard St
- 23252 Oxnard St
- 23233 Oxnard St
- 23200 Woodlake Ave
- 23247 Oxnard St
- 5932 Woodlake Ave
- 5946 Woodlake Ave
- 23229 Califa St
- 23200 W Oxnard St
- 5936 Woodlake Ave