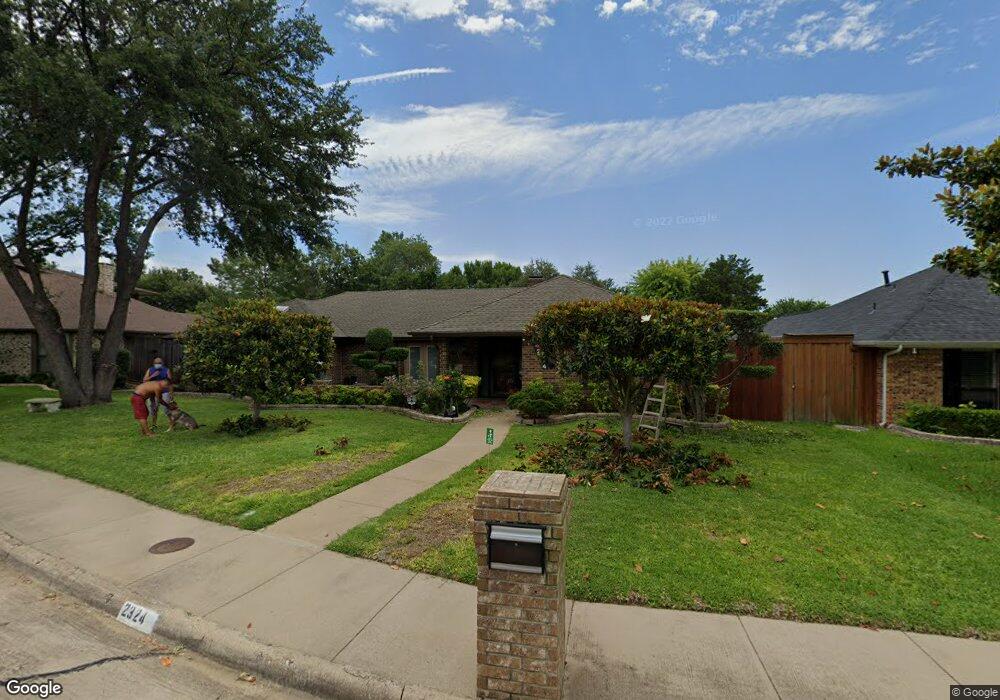
2324 Castle Rock Rd Carrollton, TX 75007
Meadow Ridge/Harvest Run NeighborhoodEstimated Value: $490,000 - $500,000
3
Beds
3
Baths
2,161
Sq Ft
$229/Sq Ft
Est. Value
About This Home
This home is located at 2324 Castle Rock Rd, Carrollton, TX 75007 and is currently estimated at $493,793, approximately $228 per square foot. 2324 Castle Rock Rd is a home located in Denton County with nearby schools including Sheffield Elementary School, Long Middle School, and Smith High School.
Ownership History
Date
Name
Owned For
Owner Type
Purchase Details
Closed on
Sep 5, 2018
Sold by
Nyman John P and Nyman Kristen K
Bought by
Hickey John and Hickey Patricia
Current Estimated Value
Home Financials for this Owner
Home Financials are based on the most recent Mortgage that was taken out on this home.
Original Mortgage
$200,000
Outstanding Balance
$174,053
Interest Rate
4.5%
Mortgage Type
Stand Alone First
Estimated Equity
$319,740
Purchase Details
Closed on
Mar 23, 2012
Sold by
Aguon Paul
Bought by
Aguon Paul and Patterson Wyndel Mark
Home Financials for this Owner
Home Financials are based on the most recent Mortgage that was taken out on this home.
Original Mortgage
$185,000
Interest Rate
3.9%
Mortgage Type
VA
Purchase Details
Closed on
Oct 28, 1996
Sold by
Berkley Myrtle C
Bought by
Ludlow Robert H and Ludlow Harbhajan K
Home Financials for this Owner
Home Financials are based on the most recent Mortgage that was taken out on this home.
Original Mortgage
$123,497
Interest Rate
8.15%
Mortgage Type
VA
Create a Home Valuation Report for This Property
The Home Valuation Report is an in-depth analysis detailing your home's value as well as a comparison with similar homes in the area
Home Values in the Area
Average Home Value in this Area
Purchase History
| Date | Buyer | Sale Price | Title Company |
|---|---|---|---|
| Hickey John | -- | Allegiance Title Co | |
| Aguon Paul | -- | None Available | |
| Aguon Paul | -- | Superior Abstract & Title Ll | |
| Ludlow Robert H | -- | -- |
Source: Public Records
Mortgage History
| Date | Status | Borrower | Loan Amount |
|---|---|---|---|
| Open | Hickey John | $200,000 | |
| Previous Owner | Aguon Paul | $185,000 | |
| Previous Owner | Ludlow Robert H | $123,497 |
Source: Public Records
Tax History Compared to Growth
Tax History
| Year | Tax Paid | Tax Assessment Tax Assessment Total Assessment is a certain percentage of the fair market value that is determined by local assessors to be the total taxable value of land and additions on the property. | Land | Improvement |
|---|---|---|---|---|
| 2025 | $6,420 | $511,578 | $111,720 | $399,858 |
| 2024 | $8,021 | $469,013 | $0 | $0 |
| 2023 | $5,736 | $426,375 | $111,720 | $382,949 |
| 2022 | $7,454 | $387,614 | $100,320 | $290,997 |
| 2021 | $7,284 | $352,376 | $72,960 | $279,416 |
| 2020 | $6,782 | $325,506 | $72,960 | $252,546 |
| 2019 | $7,025 | $320,678 | $72,960 | $247,718 |
| 2018 | $6,499 | $292,927 | $54,994 | $238,577 |
| 2017 | $5,975 | $266,297 | $54,994 | $211,303 |
| 2016 | $5,132 | $246,235 | $54,994 | $210,350 |
| 2015 | $3,876 | $223,850 | $54,994 | $204,939 |
| 2014 | $3,876 | $203,500 | $54,994 | $170,483 |
| 2013 | -- | $185,000 | $54,994 | $130,006 |
Source: Public Records
Map
Nearby Homes
- 2302 Stone Glen Ln
- 3719 Canon Gate Cir
- 3701 Canon Gate Cir
- 18816 Bilbrook Ln
- 3416 Livingston Ln
- 2111 Stein Way
- 2304 Colleen Ct
- 2707 Monet Place
- 2115 Alto Ave
- 2206 Red Bluff Dr
- 3708 Old Orchard Ct
- 2017 Stein Way
- 2514 Fallview Ln
- 2124 Lymington Rd
- 2909 Gainesborough Dr
- 18515 Timber Oaks Dr
- 2818 Monet Place
- 3913 Alto Ave
- 1920 Avignon Ct
- 2028 Victoria Rd
- 2322 Castle Rock Rd
- 2326 Castle Rock Rd
- 2325 Stone Glen Ln
- 2320 Castle Rock Rd
- 2327 Stone Glen Ln
- 2323 Stone Glen Ln
- 2328 Castle Rock Rd
- 2323 Castle Rock Rd
- 2321 Stone Glen Ln
- 2318 Castle Rock Rd
- 2330 Castle Rock Rd
- 2325 Castle Rock Rd
- 2321 Castle Rock Rd
- 2331 Stone Glen Ln
- 2319 Stone Glen Ln
- 2319 Castle Rock Rd
- 2316 Castle Rock Rd
- 2332 Castle Rock Rd
- 3707 Bishop Hill Dr
- 3705 Bishop Hill Dr