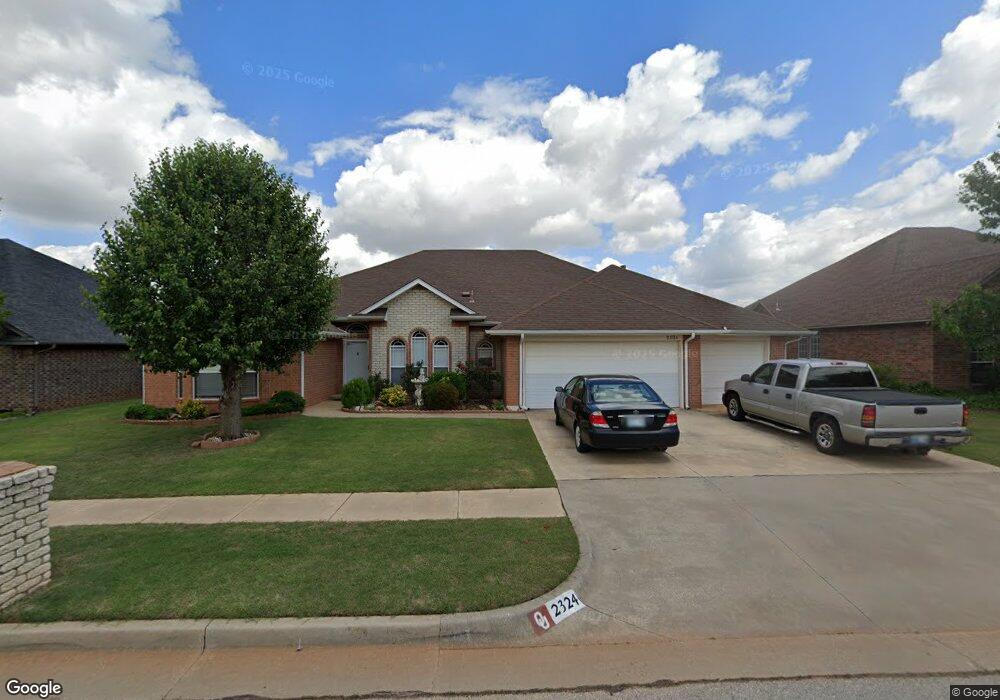
2324 Kingsley Ln Oklahoma City, OK 73128
Estimated Value: $387,000 - $409,495
4
Beds
4
Baths
2,950
Sq Ft
$135/Sq Ft
Est. Value
About This Home
This home is located at 2324 Kingsley Ln, Oklahoma City, OK 73128 and is currently estimated at $399,624, approximately $135 per square foot. 2324 Kingsley Ln is a home located in Canadian County with nearby schools including Prairie View Elementary School, Canyon Ridge Intermediate School, and Mustang North Middle School.
Ownership History
Date
Name
Owned For
Owner Type
Purchase Details
Closed on
Mar 7, 2013
Sold by
Washington Cornell and Washington Fannie L
Bought by
Washington Cornell and Washington Fannie Lee
Current Estimated Value
Purchase Details
Closed on
Jun 3, 2010
Sold by
Washington Cornell and Washington Fannie Lee
Bought by
Washington Cornell and Washington Fannie Lee
Home Financials for this Owner
Home Financials are based on the most recent Mortgage that was taken out on this home.
Original Mortgage
$192,800
Outstanding Balance
$129,532
Interest Rate
5.02%
Mortgage Type
New Conventional
Estimated Equity
$270,092
Purchase Details
Closed on
Dec 6, 2006
Sold by
Washington Cornell and Washington Fannie L
Bought by
Washington Cornell and Washington Fannie Lee
Purchase Details
Closed on
Nov 10, 2000
Sold by
J D Powers Const Llc
Purchase Details
Closed on
Feb 18, 1999
Sold by
Devon Development Inc
Create a Home Valuation Report for This Property
The Home Valuation Report is an in-depth analysis detailing your home's value as well as a comparison with similar homes in the area
Home Values in the Area
Average Home Value in this Area
Purchase History
| Date | Buyer | Sale Price | Title Company |
|---|---|---|---|
| Washington Cornell | -- | None Available | |
| Washington Cornell | -- | Fatco | |
| Washington Cornell | -- | None Available | |
| -- | $160,000 | -- | |
| -- | $50,000 | -- |
Source: Public Records
Mortgage History
| Date | Status | Borrower | Loan Amount |
|---|---|---|---|
| Open | Washington Cornell | $192,800 |
Source: Public Records
Tax History Compared to Growth
Tax History
| Year | Tax Paid | Tax Assessment Tax Assessment Total Assessment is a certain percentage of the fair market value that is determined by local assessors to be the total taxable value of land and additions on the property. | Land | Improvement |
|---|---|---|---|---|
| 2024 | $3,119 | $28,545 | $1,708 | $26,837 |
| 2023 | $3,119 | $28,546 | $1,742 | $26,804 |
| 2022 | $3,166 | $28,546 | $1,950 | $26,596 |
| 2021 | $3,154 | $28,546 | $2,277 | $26,269 |
| 2020 | $3,187 | $28,546 | $2,252 | $26,294 |
| 2019 | $3,183 | $28,546 | $2,227 | $26,319 |
| 2018 | $3,242 | $28,546 | $2,342 | $26,204 |
| 2017 | $3,201 | $28,546 | $2,342 | $26,204 |
| 2016 | $3,192 | $28,546 | $2,392 | $26,154 |
| 2015 | $2,930 | $28,546 | $2,640 | $25,906 |
| 2014 | $2,930 | $26,094 | $2,609 | $23,485 |
Source: Public Records
Map
Nearby Homes
- 2416 Kingsley Ln
- 2509 Kingsley Ln
- 2524 Renwick Ave
- 2616 Renwick Ave
- 9208 SW 22nd St
- 2417 Heather Park
- 9205 SW 25th St
- 2501 Heather Park
- 2401 Heather Park
- 2509 Heathery Park
- 2508 Heathery Park
- 9124 SW 26th St
- 2500 Heather Park
- 2408 Heather Park
- 9112 SW 20th St
- 9000 SW 20th St
- 2501 Barry Burn
- 2409 Barry Burn
- 2401 Barry Burn
- 2509 Barry Burn
- 2400 Kingsley Ln
- 2316 Kingsley Ln
- 2325 Renwick Ave
- 2317 Renwick Ave
- 2408 Kingsley Ln
- 2401 Renwick Ave
- 2325 Kingsley Ln
- 2333 Kingsley Ln
- 2401 Kingsley Ln
- 2309 Renwick Ave
- 2409 Renwick Ave
- 2317 Kingsley Ln
- 2300 Kingsley Ln
- 2409 Kingsley Ln
- 2309 Kingsley Ln
- 2301 Renwick Ave
- 2417 Renwick Ave
- 9101 SW 23rd St
- 2500 Kingsley Ln
- 2417 Kingsley Ln