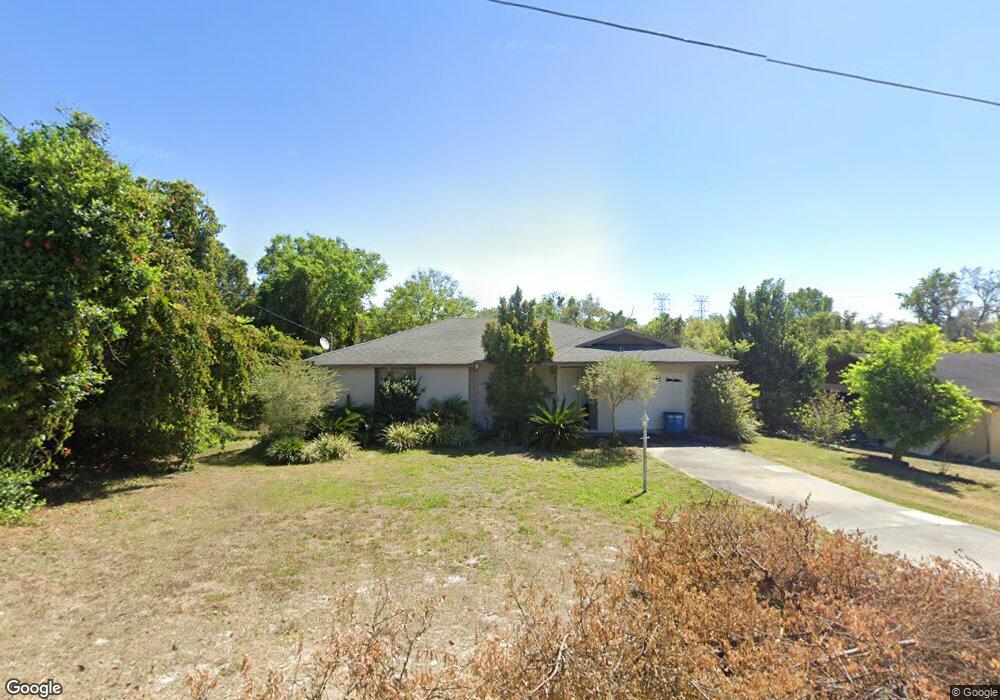
233 Clara Vista St Debary, FL 32713
Plantation Estates NeighborhoodEstimated Value: $274,138 - $309,000
3
Beds
2
Baths
1,286
Sq Ft
$226/Sq Ft
Est. Value
About This Home
This home is located at 233 Clara Vista St, Debary, FL 32713 and is currently estimated at $291,035, approximately $226 per square foot. 233 Clara Vista St is a home located in Volusia County with nearby schools including Enterprise Elementary School, River Springs Middle School, and University High School.
Ownership History
Date
Name
Owned For
Owner Type
Purchase Details
Closed on
Sep 11, 2015
Sold by
Lennox Harry T and Lennox Kathryn A
Bought by
Fillippo Emily M
Current Estimated Value
Home Financials for this Owner
Home Financials are based on the most recent Mortgage that was taken out on this home.
Original Mortgage
$122,735
Outstanding Balance
$96,499
Interest Rate
3.94%
Mortgage Type
FHA
Estimated Equity
$194,536
Purchase Details
Closed on
Jun 29, 1999
Sold by
Vance James W
Bought by
Lennox Kathryn A and Lennox Harry J
Home Financials for this Owner
Home Financials are based on the most recent Mortgage that was taken out on this home.
Original Mortgage
$52,700
Interest Rate
7.23%
Purchase Details
Closed on
Dec 14, 1994
Sold by
Vance James W and Vance Maxine P
Bought by
Vance James W
Purchase Details
Closed on
Mar 15, 1983
Bought by
Fillippo Emily M
Purchase Details
Closed on
Oct 15, 1982
Bought by
Fillippo Emily M
Create a Home Valuation Report for This Property
The Home Valuation Report is an in-depth analysis detailing your home's value as well as a comparison with similar homes in the area
Home Values in the Area
Average Home Value in this Area
Purchase History
| Date | Buyer | Sale Price | Title Company |
|---|---|---|---|
| Fillippo Emily M | $125,000 | Westside Title Services Inc | |
| Lennox Kathryn A | $58,600 | -- | |
| Vance James W | -- | -- | |
| Fillippo Emily M | $47,000 | -- | |
| Fillippo Emily M | $40,000 | -- |
Source: Public Records
Mortgage History
| Date | Status | Borrower | Loan Amount |
|---|---|---|---|
| Open | Fillippo Emily M | $122,735 | |
| Previous Owner | Lennox Kathryn A | $52,700 |
Source: Public Records
Tax History Compared to Growth
Tax History
| Year | Tax Paid | Tax Assessment Tax Assessment Total Assessment is a certain percentage of the fair market value that is determined by local assessors to be the total taxable value of land and additions on the property. | Land | Improvement |
|---|---|---|---|---|
| 2025 | $3,055 | $235,074 | $41,633 | $193,441 |
| 2024 | $3,055 | $236,247 | $41,633 | $194,614 |
| 2023 | $3,055 | $223,545 | $34,808 | $188,737 |
| 2022 | $2,770 | $191,080 | $26,276 | $164,804 |
| 2021 | $2,619 | $156,596 | $21,840 | $134,756 |
| 2020 | $2,452 | $143,032 | $16,380 | $126,652 |
| 2019 | $2,441 | $133,131 | $18,086 | $115,045 |
| 2018 | $2,228 | $120,465 | $16,039 | $104,426 |
| 2017 | $2,086 | $102,338 | $11,900 | $90,438 |
| 2016 | $1,896 | $91,949 | $0 | $0 |
| 2015 | $1,736 | $73,655 | $0 | $0 |
| 2014 | $1,496 | $62,254 | $0 | $0 |
Source: Public Records
Map
Nearby Homes
- 241 Bayou Vista St
- 262 Clara Vista St
- 257 Dirksen Dr
- 122 Homestead Ave
- 88 Dirksen Dr
- 222 Mansion Blvd
- 195 River Village Dr
- 215 Buena Vista St
- 210 Buena Vista St
- 165 Debary Dr
- 143 Debary Dr
- 211 Valencia Rd Unit 9
- 274 Toms Rd
- 138 Debary Dr
- 242 Fraser Rd
- 228 Valencia Rd
- 121 Debary Dr
- 9 Granada Rd
- 137 Caracas Rd
- 8 Santiago Rd
- 235 Clara Vista St
- 229 Clara Vista St
- 230 Acacia Rd
- 234 Acacia Rd
- 237 Clara Vista St
- 236 Clara Vista St
- 238 Clara Vista St
- 139 Sunrise Blvd
- 131 Sunrise Blvd
- 246 Clara Vista St
- 242 Clara Vista St
- 231 Acacia Rd
- 229 Acacia Rd
- 240 Acacia Rd
- 233 Acacia Rd
- 134 Sunrise Blvd
- 241 Clara Vista St
- 235 Bayou Vista St