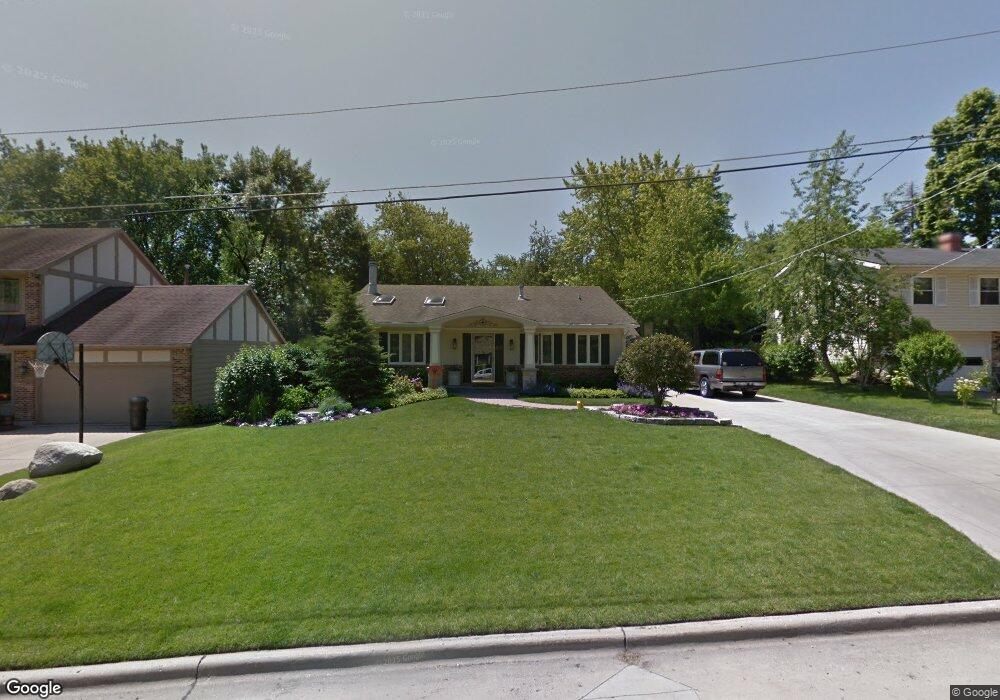
233 E Ellis Ave Libertyville, IL 60048
Estimated Value: $411,244 - $552,000
--
Bed
2
Baths
1,200
Sq Ft
$424/Sq Ft
Est. Value
About This Home
This home is located at 233 E Ellis Ave, Libertyville, IL 60048 and is currently estimated at $508,311, approximately $423 per square foot. 233 E Ellis Ave is a home located in Lake County with nearby schools including Adler Park School, Highland Middle School, and Libertyville High School.
Ownership History
Date
Name
Owned For
Owner Type
Purchase Details
Closed on
Sep 18, 2020
Sold by
Gallup William J and Gallup Justine M
Bought by
Gallup William J
Current Estimated Value
Purchase Details
Closed on
Dec 13, 1996
Sold by
Sanderson Thomas P and Sanderson Cinda S
Bought by
Gallup William J and Gallup Justine M
Home Financials for this Owner
Home Financials are based on the most recent Mortgage that was taken out on this home.
Original Mortgage
$158,000
Outstanding Balance
$13,822
Interest Rate
6.12%
Estimated Equity
$494,489
Purchase Details
Closed on
Oct 1, 1993
Sold by
Garrity Lisa and West Lisa A
Bought by
Sanderson Thomas P and Sanderson Cinda S
Home Financials for this Owner
Home Financials are based on the most recent Mortgage that was taken out on this home.
Original Mortgage
$174,800
Interest Rate
7.15%
Create a Home Valuation Report for This Property
The Home Valuation Report is an in-depth analysis detailing your home's value as well as a comparison with similar homes in the area
Home Values in the Area
Average Home Value in this Area
Purchase History
| Date | Buyer | Sale Price | Title Company |
|---|---|---|---|
| Gallup William J | -- | None Available | |
| Gallup William J | $180,000 | First American Title | |
| Sanderson Thomas P | $122,666 | Chicago Title Insurance Co |
Source: Public Records
Mortgage History
| Date | Status | Borrower | Loan Amount |
|---|---|---|---|
| Open | Gallup William J | $158,000 | |
| Previous Owner | Sanderson Thomas P | $174,800 |
Source: Public Records
Tax History Compared to Growth
Tax History
| Year | Tax Paid | Tax Assessment Tax Assessment Total Assessment is a certain percentage of the fair market value that is determined by local assessors to be the total taxable value of land and additions on the property. | Land | Improvement |
|---|---|---|---|---|
| 2024 | $9,601 | $137,932 | $65,492 | $72,440 |
| 2023 | $9,601 | $127,220 | $60,406 | $66,814 |
| 2022 | $9,302 | $122,315 | $58,060 | $64,255 |
| 2021 | $8,953 | $119,682 | $56,810 | $62,872 |
| 2020 | $8,614 | $117,670 | $55,855 | $61,815 |
| 2019 | $8,401 | $116,551 | $55,324 | $61,227 |
| 2018 | $8,191 | $117,538 | $55,173 | $62,365 |
| 2017 | $8,075 | $113,827 | $53,431 | $60,396 |
| 2016 | $7,800 | $107,924 | $50,660 | $57,264 |
| 2015 | $7,720 | $100,873 | $47,350 | $53,523 |
| 2014 | $6,952 | $93,271 | $44,490 | $48,781 |
| 2012 | $6,501 | $90,436 | $44,876 | $45,560 |
Source: Public Records
Map
Nearby Homes
- 1211 Parliament Ct
- 922 N Milwaukee Ave Unit A
- 224 Newberry Ave
- 204 W Ellis Ave
- 208 W Ellis Ave
- 212 W Ellis Ave
- 619 Parkside Ct
- 616 Parkside Ct
- 217 E Church St
- 31132-31140 N Milwaukee Ave
- 662 Parkside Ct
- 694 Parkside Ct
- 505 Lange Ct
- 212 Elm Ct
- 420 W Cook Ave
- 601 Broadway St
- 16108 W Des Plaines Dr
- 121 4th St
- 112 3rd St
- 16051 W Des Plaines Dr
- 229 E Ellis Ave
- 237 E Ellis Ave
- 929 Bartlett Terrace
- 225 E Ellis Ave
- 241 E Ellis Ave
- 931 Bartlett Terrace
- 927 Bartlett Terrace
- 232 E Ellis Ave
- 230 E Ellis Ave
- 236 E Ellis Ave
- 223 E Ellis Ave
- 925 Bartlett Terrace
- 245 E Ellis Ave
- 933 Bartlett Terrace
- 228 E Ellis Ave
- 240 E Ellis Ave
- 249 E Ellis Ave
- 224 E Ellis Ave
- 219 E Ellis Ave
- 935 Bartlett Terrace