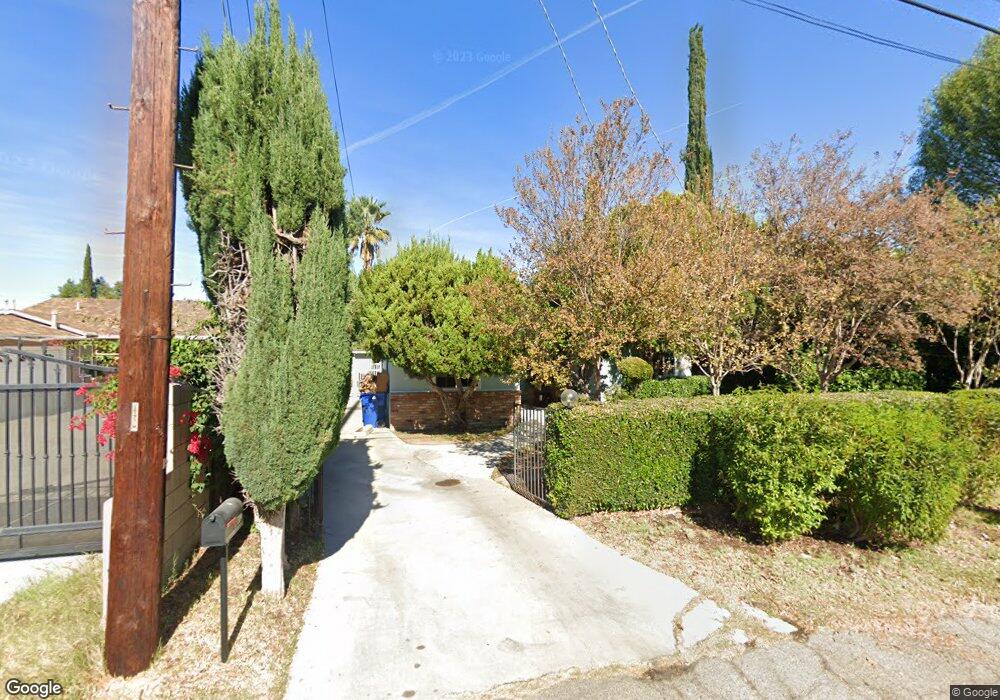
23309 Sylvan St Woodland Hills, CA 91367
Estimated Value: $943,382 - $1,047,000
3
Beds
2
Baths
1,312
Sq Ft
$766/Sq Ft
Est. Value
About This Home
This home is located at 23309 Sylvan St, Woodland Hills, CA 91367 and is currently estimated at $1,004,346, approximately $765 per square foot. 23309 Sylvan St is a home located in Los Angeles County with nearby schools including Woodlake Elementary Community Charter, Lockhurst Drive Charter Elementary, and Haynes Charter For Enriched Studies.
Ownership History
Date
Name
Owned For
Owner Type
Purchase Details
Closed on
Aug 30, 2024
Sold by
Hulugalle Sherene Carrol
Bought by
Sherene Carrol Hulugalle Trust and Hulugalle
Current Estimated Value
Purchase Details
Closed on
Mar 2, 2020
Sold by
Mason James W and Mason Marian M
Bought by
Hulugalle Sherene Carrol and Hulugalle Avanthi Michelle
Home Financials for this Owner
Home Financials are based on the most recent Mortgage that was taken out on this home.
Original Mortgage
$612,750
Interest Rate
3.6%
Mortgage Type
New Conventional
Purchase Details
Closed on
Jan 7, 2011
Sold by
Mason James W
Bought by
Mason James W and Mason Marian M
Purchase Details
Closed on
Jun 29, 2006
Sold by
Mason James W and The Clifford E Mason Living Tr
Bought by
Mason James W
Purchase Details
Closed on
Oct 15, 2002
Sold by
Mason Eddie V and Mason Doris M
Bought by
Mason Cliff E
Create a Home Valuation Report for This Property
The Home Valuation Report is an in-depth analysis detailing your home's value as well as a comparison with similar homes in the area
Home Values in the Area
Average Home Value in this Area
Purchase History
| Date | Buyer | Sale Price | Title Company |
|---|---|---|---|
| Sherene Carrol Hulugalle Trust | -- | None Listed On Document | |
| Hulugalle Sherene Carrol | $645,000 | Fidelity National Title Co | |
| Mason James W | -- | None Available | |
| Mason James W | -- | None Available | |
| Mason Cliff E | -- | -- |
Source: Public Records
Mortgage History
| Date | Status | Borrower | Loan Amount |
|---|---|---|---|
| Previous Owner | Hulugalle Sherene Carrol | $612,750 |
Source: Public Records
Tax History Compared to Growth
Tax History
| Year | Tax Paid | Tax Assessment Tax Assessment Total Assessment is a certain percentage of the fair market value that is determined by local assessors to be the total taxable value of land and additions on the property. | Land | Improvement |
|---|---|---|---|---|
| 2025 | $8,932 | $725,053 | $579,827 | $145,226 |
| 2024 | $8,835 | $710,837 | $568,458 | $142,379 |
| 2023 | $8,665 | $696,900 | $557,312 | $139,588 |
| 2022 | $8,048 | $664,713 | $531,771 | $132,942 |
| 2021 | $8,595 | $651,681 | $521,345 | $130,336 |
| 2020 | $7,837 | $636,000 | $382,000 | $254,000 |
| 2019 | $7,674 | $636,000 | $382,000 | $254,000 |
| 2018 | $7,008 | $575,000 | $345,500 | $229,500 |
| 2016 | $5,960 | $491,000 | $295,000 | $196,000 |
| 2015 | $5,960 | $491,000 | $295,000 | $196,000 |
| 2014 | $6,101 | $491,000 | $295,000 | $196,000 |
Source: Public Records
Map
Nearby Homes
- 23238 Victory Blvd
- 23432 Victory Blvd
- 6201 Melba Ave
- 6227 Glide Ave
- 6172 Dalecrest Ave
- 23549 Victory Blvd Unit 21
- 23026 Mobile St
- 6629 Bobbyboyar Ave
- 23201 Oxnard St
- 23123 Oxnard St
- 6236 Kenwater Ave
- 6001 Manton Ave
- 6416 Kenwater Place
- 6667 Royer Ave
- 23416 Califa St
- 6670 Platt Ave
- 22835 Styles St
- 6814 Berquist Ave
- 23116 Califa St
- 22851 Calvert St
- 23303 Sylvan St
- 23315 Sylvan St
- 23275 Sylvan St
- 23308 Friar St
- 23314 Friar St
- 23304 Friar St
- 23271 Sylvan St
- 23300 Friar St
- 6244 Berquist Ave
- 23270 Friar St
- 6257 Melba Ave
- 23265 Sylvan St
- 6301 Berquist Ave
- 6311 Berquist Ave
- 6257 Berquist Ave
- 23266 Friar St
- 6319 Berquist Ave
- 6234 Berquist Ave
- 23255 Sylvan St
- 6243 Berquist Ave