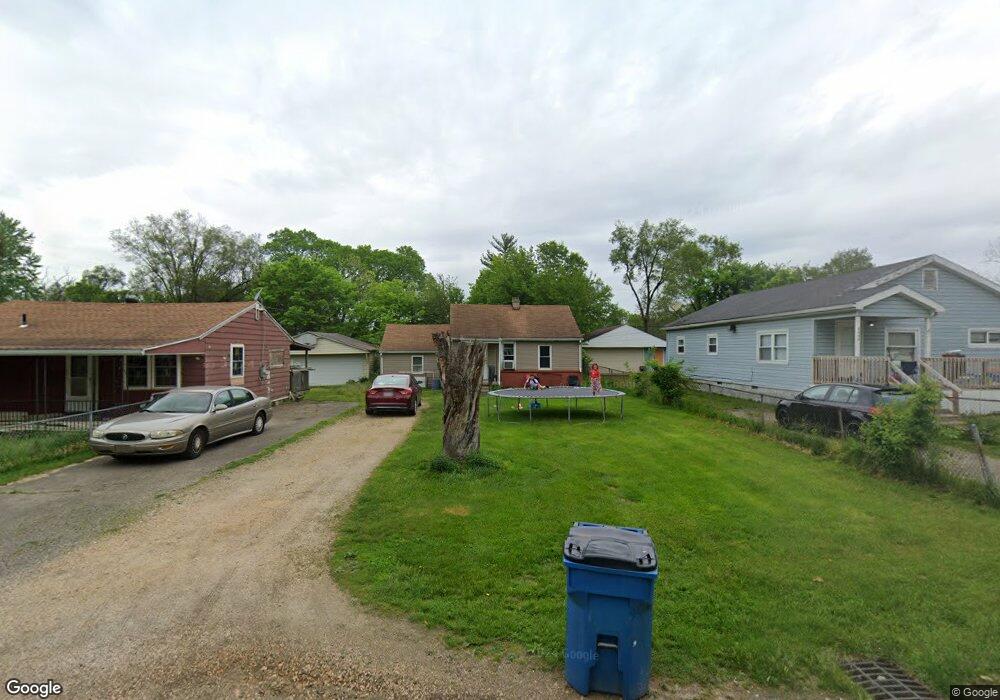
2333 Guernsey Dell Ave Dayton, OH 45404
Avondale NeighborhoodEstimated Value: $61,000 - $99,000
2
Beds
1
Bath
840
Sq Ft
$86/Sq Ft
Est. Value
About This Home
This home is located at 2333 Guernsey Dell Ave, Dayton, OH 45404 and is currently estimated at $72,401, approximately $86 per square foot. 2333 Guernsey Dell Ave is a home located in Montgomery County with nearby schools including Stebbins High School, Pathway School of Discovery, and Horizon Science Academy Dayton Downtown.
Ownership History
Date
Name
Owned For
Owner Type
Purchase Details
Closed on
Oct 29, 2006
Sold by
Fulton Richard and Fulton Rose
Bought by
Metzner Anthony W and Metzner Debra L
Current Estimated Value
Purchase Details
Closed on
Sep 15, 2006
Sold by
Wachovia Bank Of Delaware Na
Bought by
Fulton Richard
Purchase Details
Closed on
Mar 23, 2006
Sold by
Mullins Terri
Bought by
Wachovia Bank Of Delaware Na
Purchase Details
Closed on
Mar 30, 2001
Sold by
Shade Glenn B
Bought by
Mullins Terri
Home Financials for this Owner
Home Financials are based on the most recent Mortgage that was taken out on this home.
Original Mortgage
$27,500
Interest Rate
7.13%
Purchase Details
Closed on
Nov 4, 1996
Sold by
Mcghee Faye and Bryant Cora Faye
Bought by
Shade Glenn B
Purchase Details
Closed on
Nov 17, 1995
Sold by
Bryant John D
Bought by
Mcghee Faye and Bryant Cora Faye
Create a Home Valuation Report for This Property
The Home Valuation Report is an in-depth analysis detailing your home's value as well as a comparison with similar homes in the area
Home Values in the Area
Average Home Value in this Area
Purchase History
| Date | Buyer | Sale Price | Title Company |
|---|---|---|---|
| Metzner Anthony W | -- | Attorney | |
| Fulton Richard | $13,000 | Nova Title Agency Inc | |
| Wachovia Bank Of Delaware Na | $16,000 | None Available | |
| Mullins Terri | $27,500 | -- | |
| Shade Glenn B | $15,000 | -- | |
| Mcghee Faye | -- | -- |
Source: Public Records
Mortgage History
| Date | Status | Borrower | Loan Amount |
|---|---|---|---|
| Previous Owner | Mullins Terri | $27,500 |
Source: Public Records
Tax History Compared to Growth
Tax History
| Year | Tax Paid | Tax Assessment Tax Assessment Total Assessment is a certain percentage of the fair market value that is determined by local assessors to be the total taxable value of land and additions on the property. | Land | Improvement |
|---|---|---|---|---|
| 2024 | $607 | $11,820 | $4,490 | $7,330 |
| 2023 | $607 | $11,820 | $4,490 | $7,330 |
| 2022 | $648 | $9,460 | $3,590 | $5,870 |
| 2021 | $659 | $9,460 | $3,590 | $5,870 |
| 2020 | $659 | $9,460 | $3,590 | $5,870 |
| 2019 | $603 | $7,690 | $3,230 | $4,460 |
| 2018 | $604 | $7,690 | $3,230 | $4,460 |
| 2017 | $605 | $7,690 | $3,230 | $4,460 |
| 2016 | $606 | $7,480 | $3,590 | $3,890 |
| 2015 | $752 | $7,480 | $3,590 | $3,890 |
| 2014 | $752 | $7,480 | $3,590 | $3,890 |
| 2012 | -- | $12,420 | $3,590 | $8,830 |
Source: Public Records
Map
Nearby Homes
- - Prince Albert Blvd
- -- Prince Albert Blvd
- 546 Wynora Ave
- 518 Tyron Ave
- 2249 Prince Albert Blvd
- 2460 Bushnell Ave
- 2249 Valley Pike
- - Rondowa Ave
- -- Rondowa Ave
- 2245 Valley Pike
- -- Valley Pike
- - Valley Pike
- 2249 - Valley Pike
- 2301 Valley Pike
- 641 Prince Albert Blvd
- 29 Barcelona Ave
- 241 Community Dr
- 1930 Brandt Pike
- 3586 Lane Garden Ct
- 34 Ingleside Ave
- 2327 Guernsey Dell Ave
- 2335 Guernsey Dell Ave
- 2339 Guernsey Dell Ave
- 2325 Guernsey Dell Ave
- 2341 Guernsey Dell Ave
- 2338 Forest Home Ave
- 2328 Forest Home Ave
- 2340 Forest Home Ave
- 2326 Forest Home Ave
- 2343 Guernsey Dell Ave
- 2321 Guernsey Dell Ave
- 2330 Guernsey Dell Ave
- 2342 Forest Home Ave
- 2324 Forest Home Ave
- 2328 Guernsey Dell Ave
- 2334 Guernsey Dell Ave
- 2326 Guernsey Dell Ave
- 2336 Guernsey Dell Ave
- 2345 Guernsey Dell Ave
- 2316 Forest Home Ave