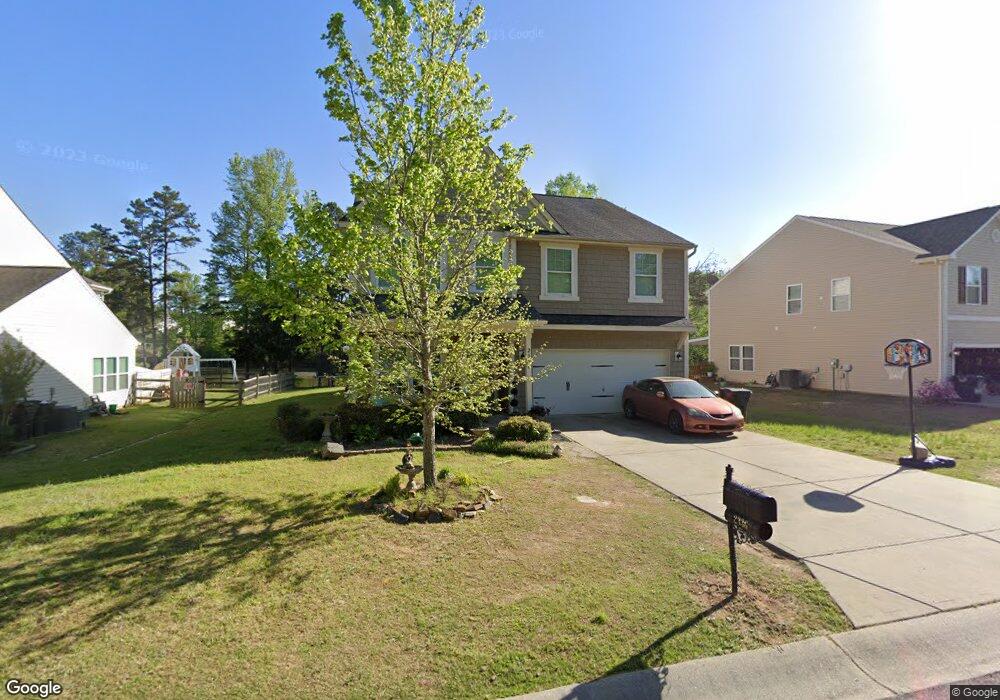
2336 Lake Vista Dr Unit 46 Mount Holly, NC 28120
Estimated Value: $417,000 - $464,000
4
Beds
3
Baths
2,922
Sq Ft
$148/Sq Ft
Est. Value
About This Home
This home is located at 2336 Lake Vista Dr Unit 46, Mount Holly, NC 28120 and is currently estimated at $433,475, approximately $148 per square foot. 2336 Lake Vista Dr Unit 46 is a home located in Gaston County with nearby schools including Springfield Primary School, Kiser Elementary School, and Stanley Middle School.
Ownership History
Date
Name
Owned For
Owner Type
Purchase Details
Closed on
Apr 19, 2022
Sold by
Melton Jr Clyde H
Bought by
Bolch Rise Owen
Current Estimated Value
Home Financials for this Owner
Home Financials are based on the most recent Mortgage that was taken out on this home.
Original Mortgage
$260,000
Outstanding Balance
$246,064
Interest Rate
5%
Mortgage Type
New Conventional
Estimated Equity
$187,411
Purchase Details
Closed on
Sep 9, 2013
Sold by
True Homes Llc
Bought by
Melton Rise Bolc and Melton Clyde H
Home Financials for this Owner
Home Financials are based on the most recent Mortgage that was taken out on this home.
Original Mortgage
$178,419
Interest Rate
4.31%
Mortgage Type
New Conventional
Purchase Details
Closed on
Mar 30, 2012
Sold by
B & C Land Holdings Llc
Bought by
True Homes Llc
Create a Home Valuation Report for This Property
The Home Valuation Report is an in-depth analysis detailing your home's value as well as a comparison with similar homes in the area
Home Values in the Area
Average Home Value in this Area
Purchase History
| Date | Buyer | Sale Price | Title Company |
|---|---|---|---|
| Bolch Rise Owen | -- | Nixon Firm Pllc | |
| Melton Rise Bolc | $188,000 | None Available | |
| True Homes Llc | $184,500 | None Available |
Source: Public Records
Mortgage History
| Date | Status | Borrower | Loan Amount |
|---|---|---|---|
| Open | Bolch Rise Owen | $260,000 | |
| Previous Owner | Melton Rise Bolc | $178,419 |
Source: Public Records
Tax History Compared to Growth
Tax History
| Year | Tax Paid | Tax Assessment Tax Assessment Total Assessment is a certain percentage of the fair market value that is determined by local assessors to be the total taxable value of land and additions on the property. | Land | Improvement |
|---|---|---|---|---|
| 2025 | $4,527 | $415,720 | $37,000 | $378,720 |
| 2024 | $4,527 | $415,720 | $37,000 | $378,720 |
| 2023 | $4,573 | $415,720 | $37,000 | $378,720 |
| 2022 | $3,295 | $244,080 | $30,000 | $214,080 |
| 2021 | $3,344 | $244,080 | $30,000 | $214,080 |
| 2019 | $3,368 | $244,080 | $30,000 | $214,080 |
| 2018 | $2,738 | $194,180 | $24,000 | $170,180 |
| 2017 | $2,700 | $194,180 | $24,000 | $170,180 |
| 2016 | $2,700 | $191,480 | $0 | $0 |
| 2014 | $2,882 | $204,370 | $40,000 | $164,370 |
Source: Public Records
Map
Nearby Homes
- 2104 Lake Vista Dr
- 2060 Lake Vista Dr
- 5010 Arbordale Way
- 5113 Arbordale Way
- 3042 Pinehills Way
- 5143 Arbordale Way
- 3173 Pinehills Way
- 3156 Pinehills Way
- 3178 Pinehills Way
- 3151 Pinehills Way
- 3127 Pinehills Way
- 00 Heather Ln
- 237 Lamplighter Ln
- 108 Mistywood Dr
- 307 Heather Ln
- 1705 High Point Terrace
- 132 General Pemberton St
- Chatham Plan at Harper Landing
- Dakota Plan at Harper Landing
- Alexander Plan at Harper Landing
- 2332 Lake Vista Dr Unit 45
- 2340 Lake Vista Dr
- 2328 Lake Vista Dr
- 2328 Lake Vista Dr Unit 44
- 2344 Lake Vista Dr
- 2341 Lake Vista Dr
- 2337 Lake Vista Dr Unit 53
- 2324 Lake Vista Dr
- 2324 Lake Vista Dr Unit 43
- 2348 Lake Vista Dr Unit 49
- 2320 Lake Vista Dr
- 2320 Lake Vista Dr Unit 42
- 2333 Lake Vista Dr Unit 54
- 2333 Lake Vista Dr
- 2352 Lake Vista Dr
- 2352 Lake Vista Dr Unit 50
- 2316 Lake Vista Dr
- 2329 Lake Vista Dr
- 2356 Lake Vista Dr Unit 51
- 2325 Lake Vista Dr