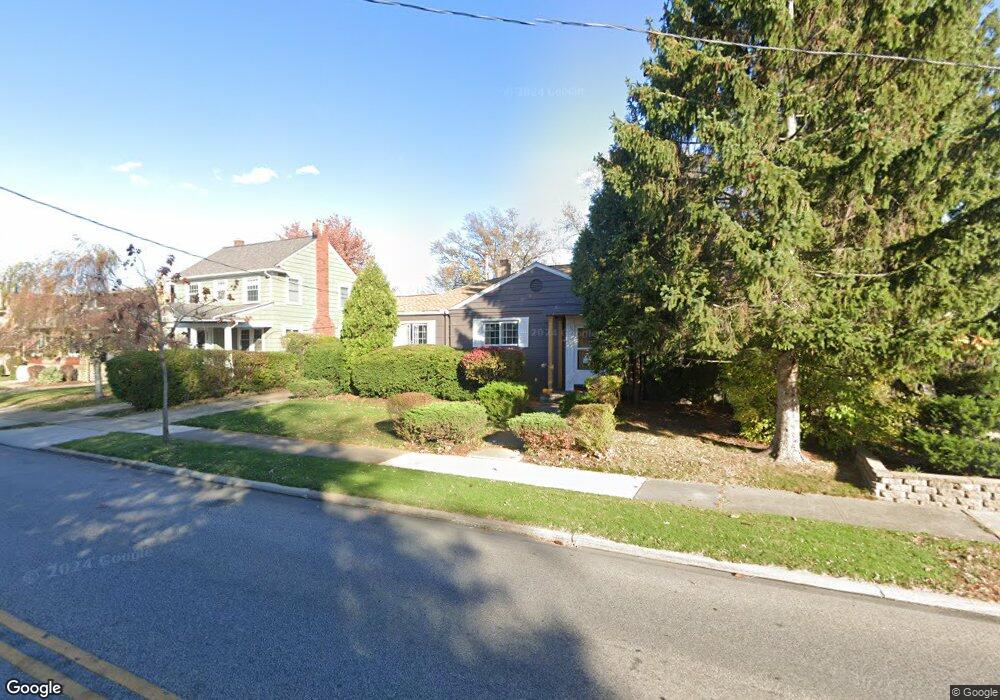
2337 Mckinley Ave Lakewood, OH 44107
Estimated Value: $294,000 - $332,000
3
Beds
2
Baths
1,517
Sq Ft
$209/Sq Ft
Est. Value
About This Home
This home is located at 2337 Mckinley Ave, Lakewood, OH 44107 and is currently estimated at $316,990, approximately $208 per square foot. 2337 Mckinley Ave is a home located in Cuyahoga County with nearby schools including Hayes Elementary School, Harding Middle School, and Lakewood High School.
Ownership History
Date
Name
Owned For
Owner Type
Purchase Details
Closed on
Mar 23, 2011
Sold by
Thingvold Erik C and Thingvold Claire J
Bought by
Orr Kevin P and Hart Katherine M
Current Estimated Value
Home Financials for this Owner
Home Financials are based on the most recent Mortgage that was taken out on this home.
Original Mortgage
$115,885
Outstanding Balance
$79,474
Interest Rate
4.75%
Mortgage Type
FHA
Estimated Equity
$237,516
Purchase Details
Closed on
Feb 24, 2005
Sold by
Bernath Angela
Bought by
Thingvold Erik C and Thingvold Claire J
Home Financials for this Owner
Home Financials are based on the most recent Mortgage that was taken out on this home.
Original Mortgage
$128,000
Interest Rate
5.8%
Mortgage Type
Purchase Money Mortgage
Purchase Details
Closed on
May 15, 1979
Sold by
Moenich Albert L and Moenich Kathryn D
Bought by
Bernath Joseph
Purchase Details
Closed on
Jan 1, 1975
Bought by
Moenich Albert L and Moenich Kathryn D
Create a Home Valuation Report for This Property
The Home Valuation Report is an in-depth analysis detailing your home's value as well as a comparison with similar homes in the area
Home Values in the Area
Average Home Value in this Area
Purchase History
| Date | Buyer | Sale Price | Title Company |
|---|---|---|---|
| Orr Kevin P | $118,900 | Barristers Title Agency | |
| Thingvold Erik C | $160,000 | Real Estate Title Service C | |
| Bernath Joseph | $70,000 | -- | |
| Moenich Albert L | -- | -- |
Source: Public Records
Mortgage History
| Date | Status | Borrower | Loan Amount |
|---|---|---|---|
| Open | Orr Kevin P | $115,885 | |
| Previous Owner | Thingvold Erik C | $128,000 | |
| Closed | Thingvold Erik C | $24,000 |
Source: Public Records
Tax History Compared to Growth
Tax History
| Year | Tax Paid | Tax Assessment Tax Assessment Total Assessment is a certain percentage of the fair market value that is determined by local assessors to be the total taxable value of land and additions on the property. | Land | Improvement |
|---|---|---|---|---|
| 2024 | $5,395 | $84,000 | $19,110 | $64,890 |
| 2023 | $5,848 | $77,910 | $19,810 | $58,100 |
| 2022 | $5,885 | $77,910 | $19,810 | $58,100 |
| 2021 | $5,825 | $77,910 | $19,810 | $58,100 |
| 2020 | $5,168 | $60,410 | $15,370 | $45,050 |
| 2019 | $5,065 | $172,600 | $43,900 | $128,700 |
| 2018 | $4,960 | $60,410 | $15,370 | $45,050 |
| 2017 | $4,896 | $53,130 | $12,740 | $40,390 |
| 2016 | $4,862 | $53,130 | $12,740 | $40,390 |
| 2015 | $4,601 | $53,130 | $12,740 | $40,390 |
| 2014 | $4,601 | $48,310 | $11,590 | $36,720 |
Source: Public Records
Map
Nearby Homes
- 2287 Ogontz Ave
- 2192 Glenbury Ave
- 2223 Eldred Ave
- 3158 W 159th St
- 2239 Woodward Ave
- 2234 Olive Ave
- 2209 Woodward Ave
- 3292 W 162nd St
- 2111 Overbrook Ave
- 15615 Fernway Ave
- 2099 Olive Ave
- 2165 Arthur Ave
- 3334 W 155th St
- 14924 Delaware Ave
- 3472 W 159th St
- 17322 Archdale Ave
- 2230 Alger Rd
- 1615 Wagar Ave
- 14926 Esther Ave
- 14924 Arden Ave
- 2331 Mckinley Ave
- 2325 Mckinley Ave
- 17112 Riverside Dr
- 17108 Riverside Dr
- 2320 Ogontz Ave
- 2320 Ogontz Ave Unit 1/DN
- 2320 Ogontz Ave Unit 2/UP
- 2320 Ogontz Ave Unit DN
- 2323 Mckinley Ave
- 2312 Ogontz Ave
- 17204 Riverside Dr
- 2326 Ogontz Ave
- 2308 Ogontz Ave
- 17100 Riverside Dr
- 2308 2310 Ogontz Ave
- 2304 Ogontz Ave
- 2324 Mckinley Ave
- 2321 Mckinley Ave
- 2320 Mckinley Ave
- 17212 Riverside Dr