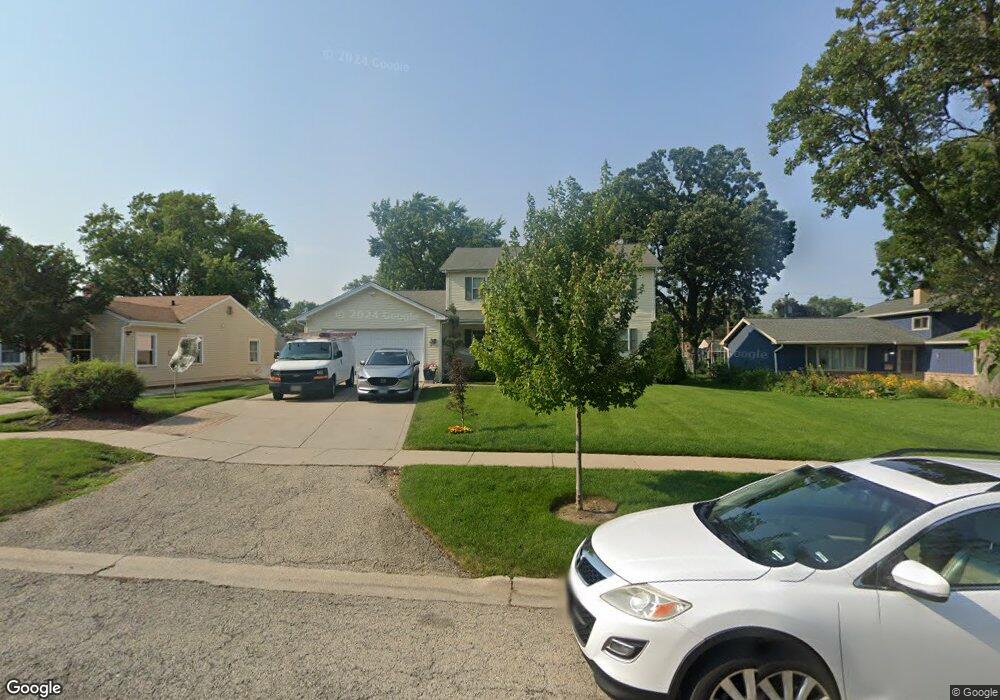
234 Grove St Mundelein, IL 60060
Estimated Value: $362,000 - $448,323
4
Beds
3
Baths
2,400
Sq Ft
$172/Sq Ft
Est. Value
About This Home
This home is located at 234 Grove St, Mundelein, IL 60060 and is currently estimated at $412,581, approximately $171 per square foot. 234 Grove St is a home located in Lake County with nearby schools including Washington Early Learning Center, Mechanics Grove Elementary School, and Carl Sandburg Middle School.
Ownership History
Date
Name
Owned For
Owner Type
Purchase Details
Closed on
Oct 10, 2006
Sold by
Cataldo Denise L and Cataldo Vincent M
Bought by
Bustamante Joel
Current Estimated Value
Home Financials for this Owner
Home Financials are based on the most recent Mortgage that was taken out on this home.
Original Mortgage
$262,176
Outstanding Balance
$163,163
Interest Rate
7.25%
Mortgage Type
Purchase Money Mortgage
Estimated Equity
$249,418
Purchase Details
Closed on
Apr 13, 2004
Sold by
Walker Kellie S and Countrywide Home Loans Inc
Bought by
Cataldo Vincent Michael and Cataldo Denise Lorraine
Purchase Details
Closed on
Aug 22, 1997
Sold by
Baldwin Marvin R and Mcroy Joyce Elaine
Bought by
Walker Linda L
Home Financials for this Owner
Home Financials are based on the most recent Mortgage that was taken out on this home.
Original Mortgage
$104,451
Interest Rate
7.56%
Mortgage Type
FHA
Purchase Details
Closed on
Jan 31, 1991
Sold by
Mcroy Robert
Bought by
Mcroy Joyce E and Baldwin Joyce Elaine
Create a Home Valuation Report for This Property
The Home Valuation Report is an in-depth analysis detailing your home's value as well as a comparison with similar homes in the area
Home Values in the Area
Average Home Value in this Area
Purchase History
| Date | Buyer | Sale Price | Title Company |
|---|---|---|---|
| Bustamante Joel | $328,000 | None Available | |
| Cataldo Vincent Michael | $121,000 | -- | |
| Walker Linda L | $70,000 | Chicago Title Insurance Co | |
| Mcroy Joyce E | -- | -- |
Source: Public Records
Mortgage History
| Date | Status | Borrower | Loan Amount |
|---|---|---|---|
| Open | Bustamante Joel | $262,176 | |
| Previous Owner | Walker Linda L | $104,451 |
Source: Public Records
Tax History Compared to Growth
Tax History
| Year | Tax Paid | Tax Assessment Tax Assessment Total Assessment is a certain percentage of the fair market value that is determined by local assessors to be the total taxable value of land and additions on the property. | Land | Improvement |
|---|---|---|---|---|
| 2024 | $10,442 | $119,882 | $20,762 | $99,120 |
| 2023 | $10,442 | $107,351 | $18,592 | $88,759 |
| 2022 | $10,233 | $102,137 | $17,871 | $84,266 |
| 2021 | $9,935 | $99,938 | $17,486 | $82,452 |
| 2020 | $9,383 | $93,579 | $16,373 | $77,206 |
| 2019 | $8,408 | $84,263 | $14,743 | $69,520 |
| 2018 | $8,174 | $82,041 | $11,849 | $70,192 |
| 2017 | $8,069 | $79,451 | $11,475 | $67,976 |
| 2016 | $8,521 | $75,331 | $10,880 | $64,451 |
| 2015 | $8,326 | $70,409 | $10,169 | $60,240 |
| 2014 | $8,390 | $69,465 | $10,033 | $59,432 |
| 2012 | $9,731 | $87,586 | $12,650 | $74,936 |
Source: Public Records
Map
Nearby Homes
- 433 E High St
- 425 S Lake St
- 510 S Hickory St
- 18 S Hawthorne Blvd
- 114 W Hawthorne Blvd
- 40 S Seymour Ave
- 228 Woodlawn Dr
- 701 Thomas Ct
- 130 Shadydell Ave
- 640 Allanson Rd
- 29746 U S 45
- 49 N Shaddle Ave
- 116 N Prairie Ave
- 51 S Pershing Ave
- 116 S Pershing Ave
- 331 Plaza Cir
- 261 N Shaddle Ave
- 31 Washington Blvd Unit 108
- 841 Wilcox St
- 207 Shady Ln
- 242 Grove St
- 226 Grove St
- 221 E Hawthorne Blvd
- 310 Grove St
- 227 E Hawthorne Blvd
- 218 Grove St
- 215 E Hawthorne Blvd
- 303 E Hawthorne Blvd
- 209 E Hawthorne Blvd
- 233 Grove St
- 241 Grove St
- 225 Grove St
- 318 Grove St
- 309 E Hawthorne Blvd
- 210 Grove St
- 203 E Hawthorne Blvd
- 217 Grove St
- 309 Grove St
- 210 S Midland Ave
- 133 E Hawthorne Blvd