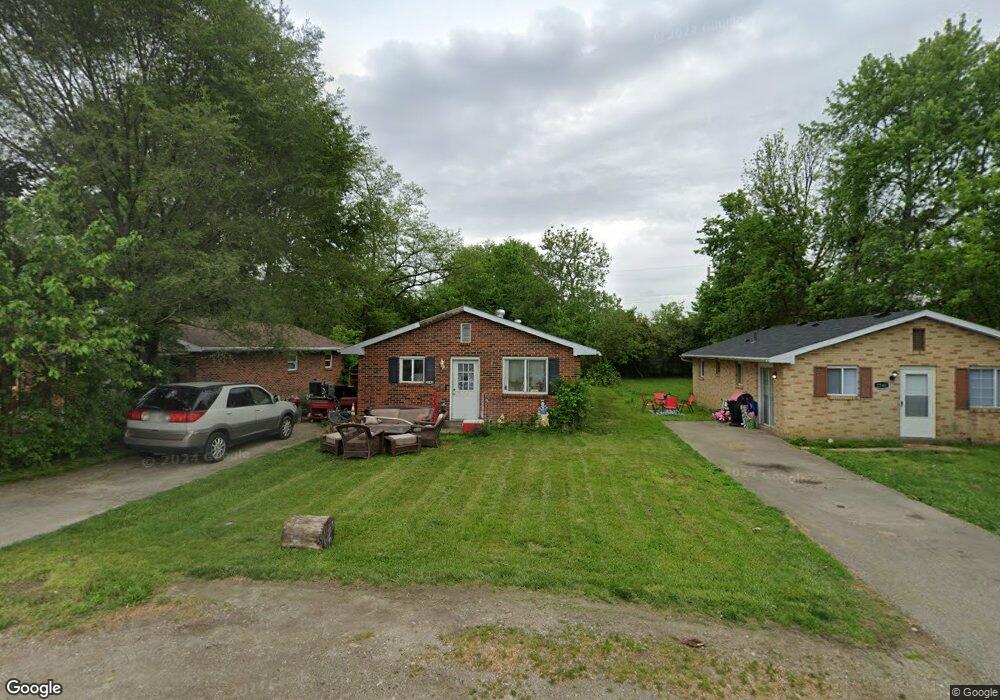
2342 Guernsey Dell Ave Dayton, OH 45404
Avondale NeighborhoodEstimated Value: $135,000 - $144,000
4
Beds
2
Baths
1,350
Sq Ft
$104/Sq Ft
Est. Value
About This Home
This home is located at 2342 Guernsey Dell Ave, Dayton, OH 45404 and is currently estimated at $140,473, approximately $104 per square foot. 2342 Guernsey Dell Ave is a home located in Montgomery County with nearby schools including Stebbins High School, Pathway School of Discovery, and Liberty High School.
Ownership History
Date
Name
Owned For
Owner Type
Purchase Details
Closed on
Jun 19, 2007
Sold by
Metzner William
Bought by
Metzner William and Metzner Debra L
Current Estimated Value
Purchase Details
Closed on
Mar 26, 2007
Sold by
Deutsche Bank National Trust Co
Bought by
Metzner William
Purchase Details
Closed on
Jan 11, 2007
Sold by
Fleming Barbara Jo
Bought by
Deutsche Bank National Trust Co and First Franklin Mortgage Loan Trust 2005-
Purchase Details
Closed on
Sep 23, 2005
Sold by
Hammons Kenneth Grant and Hammons Rebecca Suzanne
Bought by
Fleming Barbara Jo
Home Financials for this Owner
Home Financials are based on the most recent Mortgage that was taken out on this home.
Original Mortgage
$82,000
Interest Rate
8%
Mortgage Type
Fannie Mae Freddie Mac
Create a Home Valuation Report for This Property
The Home Valuation Report is an in-depth analysis detailing your home's value as well as a comparison with similar homes in the area
Home Values in the Area
Average Home Value in this Area
Purchase History
| Date | Buyer | Sale Price | Title Company |
|---|---|---|---|
| Metzner William | -- | American Homeland Title Agen | |
| Metzner William | $26,000 | American Homeland Title Agen | |
| Deutsche Bank National Trust Co | $42,000 | None Available | |
| Fleming Barbara Jo | $82,000 | -- |
Source: Public Records
Mortgage History
| Date | Status | Borrower | Loan Amount |
|---|---|---|---|
| Previous Owner | Fleming Barbara Jo | $82,000 |
Source: Public Records
Tax History Compared to Growth
Tax History
| Year | Tax Paid | Tax Assessment Tax Assessment Total Assessment is a certain percentage of the fair market value that is determined by local assessors to be the total taxable value of land and additions on the property. | Land | Improvement |
|---|---|---|---|---|
| 2024 | $1,526 | $30,860 | $4,490 | $26,370 |
| 2023 | $1,526 | $30,860 | $4,490 | $26,370 |
| 2022 | $1,629 | $24,680 | $3,590 | $21,090 |
| 2021 | $1,660 | $24,680 | $3,590 | $21,090 |
| 2020 | $1,659 | $24,680 | $3,590 | $21,090 |
| 2019 | $1,839 | $24,460 | $3,230 | $21,230 |
| 2018 | $1,843 | $24,460 | $3,230 | $21,230 |
| 2017 | $1,844 | $24,460 | $3,230 | $21,230 |
| 2016 | $1,778 | $23,510 | $3,590 | $19,920 |
| 2015 | $1,906 | $23,510 | $3,590 | $19,920 |
| 2014 | $1,906 | $23,510 | $3,590 | $19,920 |
| 2012 | -- | $21,450 | $3,590 | $17,860 |
Source: Public Records
Map
Nearby Homes
- 546 Wynora Ave
- 2460 Bushnell Ave
- - Prince Albert Blvd
- -- Prince Albert Blvd
- 2249 Prince Albert Blvd
- 518 Tyron Ave
- 2249 Valley Pike
- 2245 Valley Pike
- -- Valley Pike
- - Valley Pike
- 2249 - Valley Pike
- 2301 Valley Pike
- - Rondowa Ave
- -- Rondowa Ave
- 641 Prince Albert Blvd
- 29 Barcelona Ave
- 241 Community Dr
- 1930 Brandt Pike
- 3586 Lane Garden Ct
- 34 Ingleside Ave
- 2040 Guernsey Dell Ave
- 2344 Guernsey Dell Ave
- 2350 Guernsey Dell Ave
- 2336 Guernsey Dell Ave
- 2357 Bushnell Ave
- 2359 Bushnell Ave
- 2361 Bushnell Ave
- 2354 Guernsey Dell Ave
- 2334 Guernsey Dell Ave
- 2345 Guernsey Dell Ave
- 2365 Bushnell Ave
- 2349 Guernsey Dell Ave
- 2343 Guernsey Dell Ave
- 2339 Guernsey Dell Ave
- 2341 Guernsey Dell Ave
- 2330 Guernsey Dell Ave
- 2353 Bushnell Ave
- 2353 Guernsey Dell Ave
- 2357 Guernsey Dell Ave
- 2335 Guernsey Dell Ave