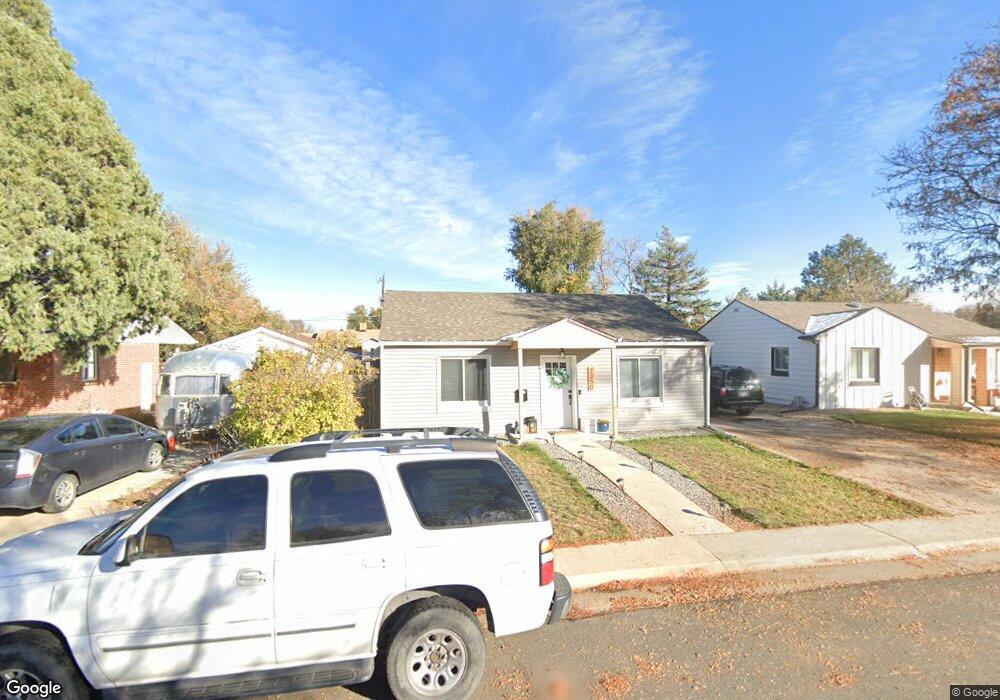
2350 Galena St Aurora, CO 80010
North Aurora NeighborhoodEstimated Value: $476,000 - $614,000
5
Beds
3
Baths
2,460
Sq Ft
$227/Sq Ft
Est. Value
About This Home
This home is located at 2350 Galena St, Aurora, CO 80010 and is currently estimated at $559,071, approximately $227 per square foot. 2350 Galena St is a home located in Adams County with nearby schools including Lincoln Elementary School, North Middle School Health Sciences & Technology, and El Camino High School.
Ownership History
Date
Name
Owned For
Owner Type
Purchase Details
Closed on
Mar 12, 2025
Sold by
Lauchmen Cory and Lauchmen Stephanie
Bought by
Kent Jordan
Current Estimated Value
Home Financials for this Owner
Home Financials are based on the most recent Mortgage that was taken out on this home.
Original Mortgage
$608,770
Outstanding Balance
$605,702
Interest Rate
6.95%
Mortgage Type
FHA
Estimated Equity
-$46,631
Purchase Details
Closed on
Apr 27, 2021
Sold by
Gtg Ventures Llc
Bought by
Levine Mark
Purchase Details
Closed on
Jan 5, 2021
Sold by
Traversie Doris A and Traversie Keith Duane
Bought by
Gtg Ventures Llc
Home Financials for this Owner
Home Financials are based on the most recent Mortgage that was taken out on this home.
Original Mortgage
$301,500
Interest Rate
2.7%
Mortgage Type
Credit Line Revolving
Create a Home Valuation Report for This Property
The Home Valuation Report is an in-depth analysis detailing your home's value as well as a comparison with similar homes in the area
Home Values in the Area
Average Home Value in this Area
Purchase History
| Date | Buyer | Sale Price | Title Company |
|---|---|---|---|
| Kent Jordan | $620,000 | First Integrity Title | |
| Levine Mark | $460,000 | Capital Title | |
| Gtg Ventures Llc | $225,000 | Assured Title Agency |
Source: Public Records
Mortgage History
| Date | Status | Borrower | Loan Amount |
|---|---|---|---|
| Open | Kent Jordan | $608,770 | |
| Previous Owner | Gtg Ventures Llc | $301,500 | |
| Previous Owner | Gtg Ventures Llc | $60,000 |
Source: Public Records
Tax History Compared to Growth
Tax History
| Year | Tax Paid | Tax Assessment Tax Assessment Total Assessment is a certain percentage of the fair market value that is determined by local assessors to be the total taxable value of land and additions on the property. | Land | Improvement |
|---|---|---|---|---|
| 2024 | $2,791 | $36,130 | $5,000 | $31,130 |
| 2023 | $2,836 | $41,940 | $5,210 | $36,730 |
| 2022 | $2,627 | $23,120 | $5,350 | $17,770 |
| 2021 | $2,737 | $23,120 | $5,350 | $17,770 |
| 2020 | $1,859 | $22,900 | $5,510 | $17,390 |
| 2019 | $1,855 | $22,900 | $5,510 | $17,390 |
| 2018 | $1,326 | $18,410 | $4,320 | $14,090 |
| 2017 | $1,178 | $18,410 | $4,320 | $14,090 |
| 2016 | $699 | $13,200 | $2,390 | $10,810 |
| 2015 | $677 | $6,600 | $1,190 | $5,410 |
| 2014 | $627 | $6,010 | $960 | $5,050 |
Source: Public Records
Map
Nearby Homes
- 2332 Galena St
- 10159 E 25th Dr
- 2285 Fulton St
- 2226 Fulton St
- 2356 Elmira St
- 2097 Hanover St
- 2356 Emporia St
- 2348 Emporia St
- 2086 Hanover St
- 2060 Fulton St
- 10138 E 28th Ave
- 2572 Iola St
- 9833 E 26th Ave Unit 9833
- 2086 Elmira St
- 2241 Ironton St
- 2626 Emporia St
- 2080 Emporia St
- 2028 Havana St
- 2000 Elmira St
- 2064 Ironton St