23516 23rd Dr NE Arlington, WA 98223
Estimated Value: $960,051 - $1,205,000
3
Beds
3
Baths
2,385
Sq Ft
$443/Sq Ft
Est. Value
About This Home
This home is located at 23516 23rd Dr NE, Arlington, WA 98223 and is currently estimated at $1,056,763, approximately $443 per square foot. 23516 23rd Dr NE is a home located in Snohomish County with nearby schools including Presidents Elementary School, Haller Middle School, and Weston High School.
Ownership History
Date
Name
Owned For
Owner Type
Purchase Details
Closed on
Oct 24, 2024
Sold by
Stillaguamish Tribe Of Indians
Bought by
United States Of America and Stillaguamish Tribe Of Indians
Current Estimated Value
Purchase Details
Closed on
Jun 24, 2015
Sold by
Larson Richard R and Larson Marlene R
Bought by
Stillaquamish Tribe Of Indians
Purchase Details
Closed on
Jul 9, 2001
Sold by
Ernesti Aaron J
Bought by
Larson Richard R and Larson Marlene R
Home Financials for this Owner
Home Financials are based on the most recent Mortgage that was taken out on this home.
Original Mortgage
$271,850
Interest Rate
7.26%
Purchase Details
Closed on
Apr 17, 2000
Sold by
Parkinson Roger K
Bought by
Ernesti Aaron J
Home Financials for this Owner
Home Financials are based on the most recent Mortgage that was taken out on this home.
Original Mortgage
$77,000
Interest Rate
8.24%
Mortgage Type
Seller Take Back
Create a Home Valuation Report for This Property
The Home Valuation Report is an in-depth analysis detailing your home's value as well as a comparison with similar homes in the area
Home Values in the Area
Average Home Value in this Area
Purchase History
| Date | Buyer | Sale Price | Title Company |
|---|---|---|---|
| United States Of America | $313 | Chicago Title | |
| Stillaquamish Tribe Of Indians | $550,000 | Chicago Title Company | |
| Larson Richard R | $4,113,000 | Chicago Title Insurance Co | |
| Ernesti Aaron J | -- | Old Republic Title Ltd |
Source: Public Records
Mortgage History
| Date | Status | Borrower | Loan Amount |
|---|---|---|---|
| Previous Owner | Larson Richard R | $271,850 | |
| Previous Owner | Ernesti Aaron J | $77,000 |
Source: Public Records
Tax History Compared to Growth
Tax History
| Year | Tax Paid | Tax Assessment Tax Assessment Total Assessment is a certain percentage of the fair market value that is determined by local assessors to be the total taxable value of land and additions on the property. | Land | Improvement |
|---|---|---|---|---|
| 2025 | $6,983 | $900,800 | $401,700 | $499,100 |
| 2024 | $6,983 | $811,200 | $328,000 | $483,200 |
| 2023 | $6,806 | $848,900 | $355,200 | $493,700 |
| 2022 | $6,537 | $668,600 | $265,900 | $402,700 |
| 2020 | $5,964 | $567,700 | $211,600 | $356,100 |
| 2019 | $5,629 | $534,500 | $196,100 | $338,400 |
| 2018 | $6,564 | $502,800 | $180,600 | $322,200 |
| 2017 | $5,562 | $431,600 | $126,300 | $305,300 |
| 2016 | $5,737 | $419,800 | $125,000 | $294,800 |
| 2015 | -- | $414,800 | $137,000 | $277,800 |
| 2013 | $5,065 | $336,400 | $101,000 | $235,400 |
Source: Public Records
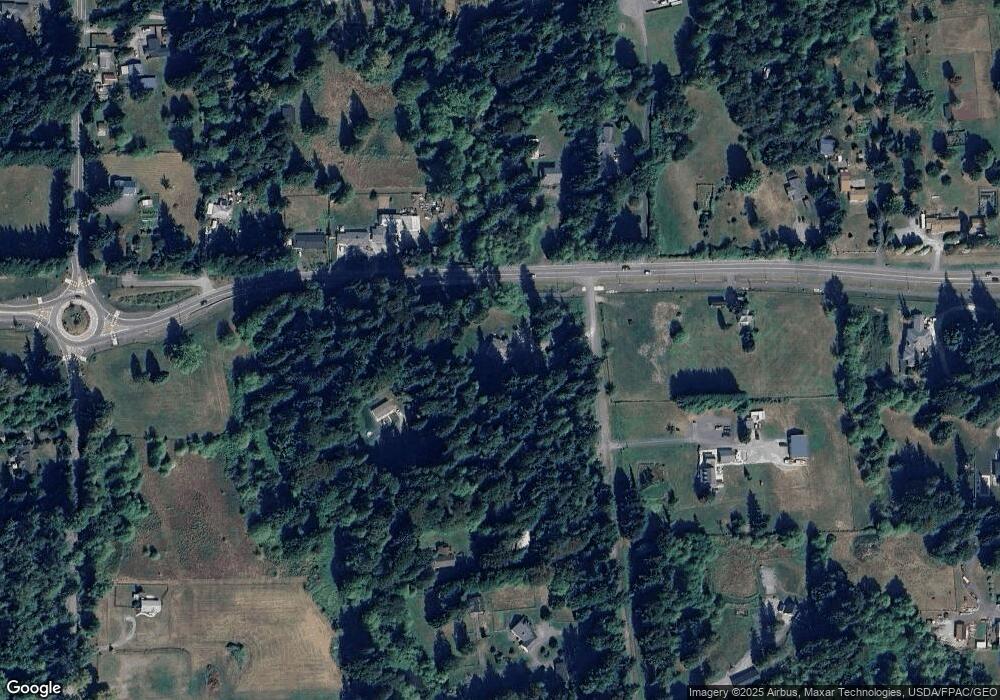
Map
Nearby Homes
- 24422 19th Ave NE
- 25204 19th Ave NE
- 3630 252nd St NE
- 21916 7th Ave NE
- 3830 257th St NE
- 25106 47th Ave NE
- 4718 252nd St NE
- 5222 233rd Place NE
- 2714 268th St NE
- 26306 2nd Ave NE
- 20102 33rd Ave NE
- 25606 Mountain Dr
- 0 212th St NW Unit NWM2361404
- 26807 3rd Ave NE
- 26913 3rd Ave NE
- 26927 3rd Ave NE
- 19605 Smokey Point Blvd
- 20217 45th Dr NE
- 1022 259th St NW
- 4502 200th St NE
- 23426 23rd Dr NE
- 2121 236th St NE
- 2406 236th St NE
- 2207 236th St NE
- 23328 23rd Dr NE
- 2029 236th St NE
- 2307 236th St NE
- 23405 23rd Dr NE
- 23232 23rd Dr NE
- 1918 236th St NE
- 2003 236th St NE
- 2421 236th St NE
- 2509 236th St NE
- 1913 236th St NE
- 23301 23rd Dr NE
- 23516 27th Ave NE
- 23813 19th Ave NE
- 23206 23rd Dr NE
- 23309 19th Dr NE
- 2311 236th St NE