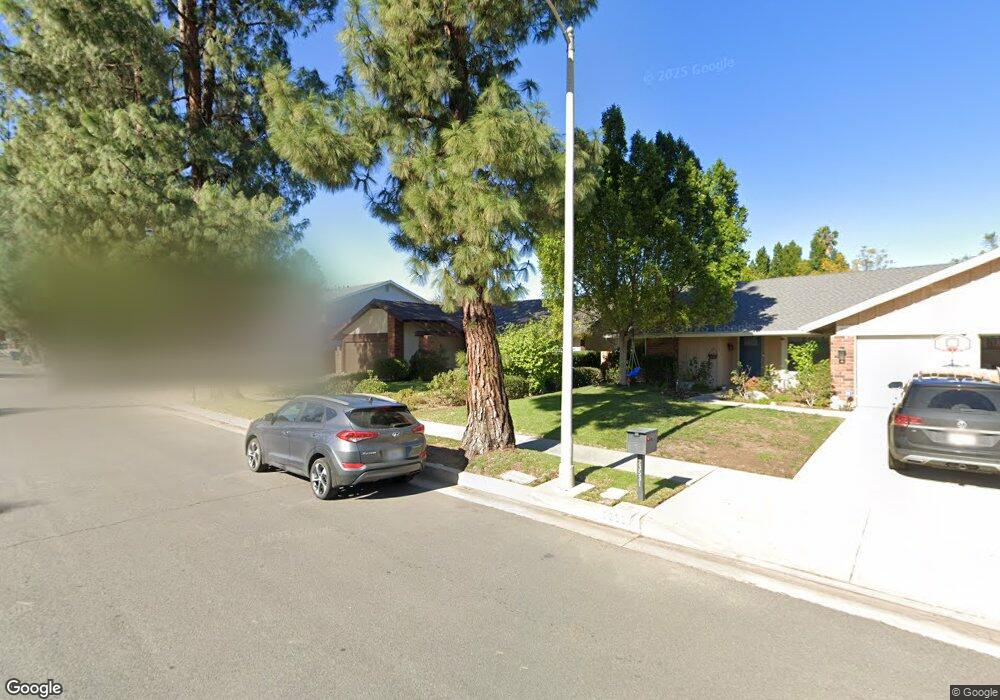
23537 Spires St Canoga Park, CA 91304
Canoga Park NeighborhoodEstimated Value: $969,384 - $1,315,000
4
Beds
2
Baths
1,856
Sq Ft
$642/Sq Ft
Est. Value
About This Home
This home is located at 23537 Spires St, Canoga Park, CA 91304 and is currently estimated at $1,191,596, approximately $642 per square foot. 23537 Spires St is a home located in Los Angeles County with nearby schools including Pomelo Community Charter, Justice Street Academy Charter, and Enadia Way Technology Charter.
Ownership History
Date
Name
Owned For
Owner Type
Purchase Details
Closed on
Apr 4, 2025
Sold by
Bermudez Jarymar
Bought by
Rivera John Anthony Burg
Current Estimated Value
Home Financials for this Owner
Home Financials are based on the most recent Mortgage that was taken out on this home.
Original Mortgage
$650,000
Outstanding Balance
$646,601
Interest Rate
6.76%
Mortgage Type
New Conventional
Estimated Equity
$544,995
Purchase Details
Closed on
Feb 26, 2025
Sold by
Josephine Dosal Angona Trust and Rivera John Anthony
Bought by
Rivera John Anthony Burg
Home Financials for this Owner
Home Financials are based on the most recent Mortgage that was taken out on this home.
Original Mortgage
$650,000
Outstanding Balance
$646,601
Interest Rate
6.76%
Mortgage Type
New Conventional
Estimated Equity
$544,995
Purchase Details
Closed on
Feb 19, 2008
Sold by
Angona Josephine Dosal
Bought by
Angona Josephine Dosal and Josephine Dosal Angona Trust
Create a Home Valuation Report for This Property
The Home Valuation Report is an in-depth analysis detailing your home's value as well as a comparison with similar homes in the area
Home Values in the Area
Average Home Value in this Area
Purchase History
| Date | Buyer | Sale Price | Title Company |
|---|---|---|---|
| Rivera John Anthony Burg | -- | Wfg National Title | |
| Rivera John Anthony Burg | -- | Wfg National Title | |
| Angona Josephine Dosal | -- | None Available |
Source: Public Records
Mortgage History
| Date | Status | Borrower | Loan Amount |
|---|---|---|---|
| Open | Rivera John Anthony Burg | $650,000 |
Source: Public Records
Tax History Compared to Growth
Tax History
| Year | Tax Paid | Tax Assessment Tax Assessment Total Assessment is a certain percentage of the fair market value that is determined by local assessors to be the total taxable value of land and additions on the property. | Land | Improvement |
|---|---|---|---|---|
| 2025 | $2,404 | $175,520 | $67,661 | $107,859 |
| 2024 | $2,404 | $172,080 | $66,335 | $105,745 |
| 2023 | $2,363 | $168,707 | $65,035 | $103,672 |
| 2022 | $2,264 | $165,400 | $63,760 | $101,640 |
| 2021 | $2,227 | $162,158 | $62,510 | $99,648 |
| 2019 | $2,165 | $157,351 | $60,657 | $96,694 |
| 2018 | $2,078 | $154,267 | $59,468 | $94,799 |
| 2016 | $1,968 | $148,278 | $57,159 | $91,119 |
| 2015 | $1,942 | $146,052 | $56,301 | $89,751 |
| 2014 | $1,958 | $143,192 | $55,199 | $87,993 |
Source: Public Records
Map
Nearby Homes
- 7556 Chaminade Ave
- 23716 Elkwood St
- 23676 Justice St
- 23708 Sandalwood St
- 23200 Justice St
- 7432 Dorie Dr
- 7729 Sedan Ave
- 7422 Kyle Ct
- 23774 Burton St
- 7442 Bobbyboyar Ave
- 23234 Valerio St
- 24004 Arminta St
- 7446 Woodlake Ave
- 7417 Darnoch Way
- 7474 Darnoch Way
- 24005 Clarington Dr
- 8324 Joan Ln
- 23546 Community St
- 7925 Royer Ave
- 7282 Woodvale Ct
- 23545 Spires St
- 23531 Spires St
- 23531 Spires St
- 23525 Spires St
- 23553 Spires St
- 7800 Hillary Dr
- 23519 Spires St
- 23601 Spires St
- 23536 Spires St
- 23544 Spires St
- 23530 Spires St
- 23520 Elkwood St
- 23552 Spires St
- 23509 Spires St
- 7810 Hillary Dr
- 23609 Spires St
- 23524 Elkwood St
- 23600 Spires St
- 23518 Spires St
- 23600 Elkwood St