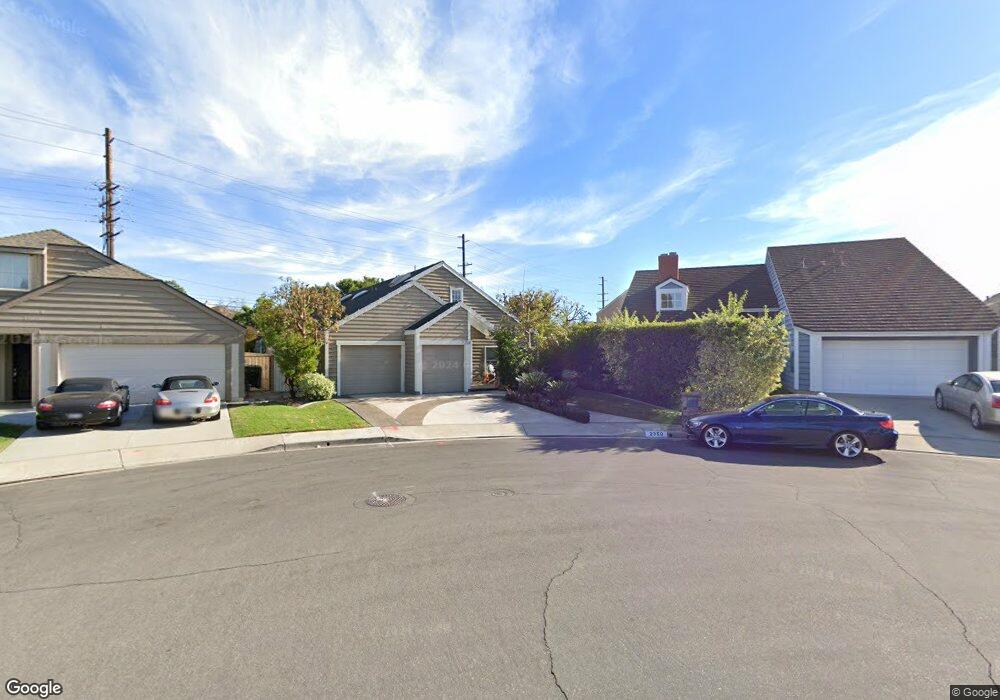
2359 Purdue Dr Costa Mesa, CA 92626
Estimated Value: $1,145,000 - $1,792,000
3
Beds
3
Baths
2,571
Sq Ft
$595/Sq Ft
Est. Value
About This Home
This home is located at 2359 Purdue Dr, Costa Mesa, CA 92626 and is currently estimated at $1,529,976, approximately $595 per square foot. 2359 Purdue Dr is a home located in Orange County with nearby schools including College Park Elementary School, Costa Mesa High School, and Montessori Christian School.
Ownership History
Date
Name
Owned For
Owner Type
Purchase Details
Closed on
Oct 8, 2015
Sold by
Dearing Steven T
Bought by
The Dearing Family Living Trust
Current Estimated Value
Purchase Details
Closed on
Jun 19, 1997
Sold by
Stapakis Steven
Bought by
Dearing Steven T and Quintanar Emily
Home Financials for this Owner
Home Financials are based on the most recent Mortgage that was taken out on this home.
Original Mortgage
$216,000
Interest Rate
7.94%
Purchase Details
Closed on
Feb 25, 1997
Sold by
Kootsikas Joanne C
Bought by
Stapakis Steven
Home Financials for this Owner
Home Financials are based on the most recent Mortgage that was taken out on this home.
Original Mortgage
$100,000
Interest Rate
7.81%
Purchase Details
Closed on
Jan 21, 1997
Sold by
Katsampes George Thomas and Katsampes Rebecca Ann
Bought by
Stapakis Steven
Home Financials for this Owner
Home Financials are based on the most recent Mortgage that was taken out on this home.
Original Mortgage
$100,000
Interest Rate
7.81%
Create a Home Valuation Report for This Property
The Home Valuation Report is an in-depth analysis detailing your home's value as well as a comparison with similar homes in the area
Home Values in the Area
Average Home Value in this Area
Purchase History
| Date | Buyer | Sale Price | Title Company |
|---|---|---|---|
| The Dearing Family Living Trust | -- | None Available | |
| Dearing Steven T | $270,000 | Benefit Land Title Company | |
| Stapakis Steven | -- | Fidelity National Title Ins | |
| Stapakis Steven | $189,100 | -- |
Source: Public Records
Mortgage History
| Date | Status | Borrower | Loan Amount |
|---|---|---|---|
| Previous Owner | Dearing Steven T | $216,000 | |
| Previous Owner | Stapakis Steven | $100,000 |
Source: Public Records
Tax History Compared to Growth
Tax History
| Year | Tax Paid | Tax Assessment Tax Assessment Total Assessment is a certain percentage of the fair market value that is determined by local assessors to be the total taxable value of land and additions on the property. | Land | Improvement |
|---|---|---|---|---|
| 2025 | $5,473 | $439,737 | $225,025 | $214,712 |
| 2024 | $5,473 | $431,115 | $220,613 | $210,502 |
| 2023 | $5,275 | $422,662 | $216,287 | $206,375 |
| 2022 | $5,076 | $414,375 | $212,046 | $202,329 |
| 2021 | $4,913 | $406,250 | $207,888 | $198,362 |
| 2020 | $4,851 | $402,085 | $205,756 | $196,329 |
| 2019 | $4,747 | $394,201 | $201,721 | $192,480 |
| 2018 | $4,651 | $386,472 | $197,766 | $188,706 |
| 2017 | $4,574 | $378,895 | $193,889 | $185,006 |
| 2016 | $4,478 | $371,466 | $190,087 | $181,379 |
| 2015 | $4,433 | $365,887 | $187,232 | $178,655 |
| 2014 | $4,334 | $358,720 | $183,564 | $175,156 |
Source: Public Records
Map
Nearby Homes
- 2404 Niagara Way
- 117 Clearbrook Ln
- 208 Dartmouth Place
- 157 Yorktown Ln
- 101 Clearbrook Ln
- 2520 Andover Place
- 2334 Richmond Way
- 2330 Vanguard Way Unit L101
- 2330 Vanguard Way Unit F102
- 2273 Columbia Dr
- 2323 Cornell Dr
- 2459 Elden Ave
- 380 W Wilson St Unit C104
- 117 E Wilson St Unit C
- 2214 Rutgers Dr
- 403 Aura Dr
- 327 W Wilson St Unit 86
- 327 W Wilson St Unit 49
- 168 Monte Vista Ave
- 2336 Elden Ave Unit A
- 2353 Purdue Dr
- 2365 Purdue Dr
- 2336 Littleton Cir
- 2347 Purdue Dr
- 2330 Littleton Cir
- 2371 Purdue Dr
- 2342 Littleton Cir
- 2341 Purdue Dr
- 2348 Littleton Cir
- 2344 Purdue Dr
- 2377 Purdue Dr
- 191 Fairwinds
- 2482 Fairview Way
- 2335 Purdue Dr
- 2480 Fairview Rd
- 2484 Fairview Way
- 189 Fairwinds
- 2354 Littleton Cir
- 2340 Purdue Dr
- 190 Fairwinds