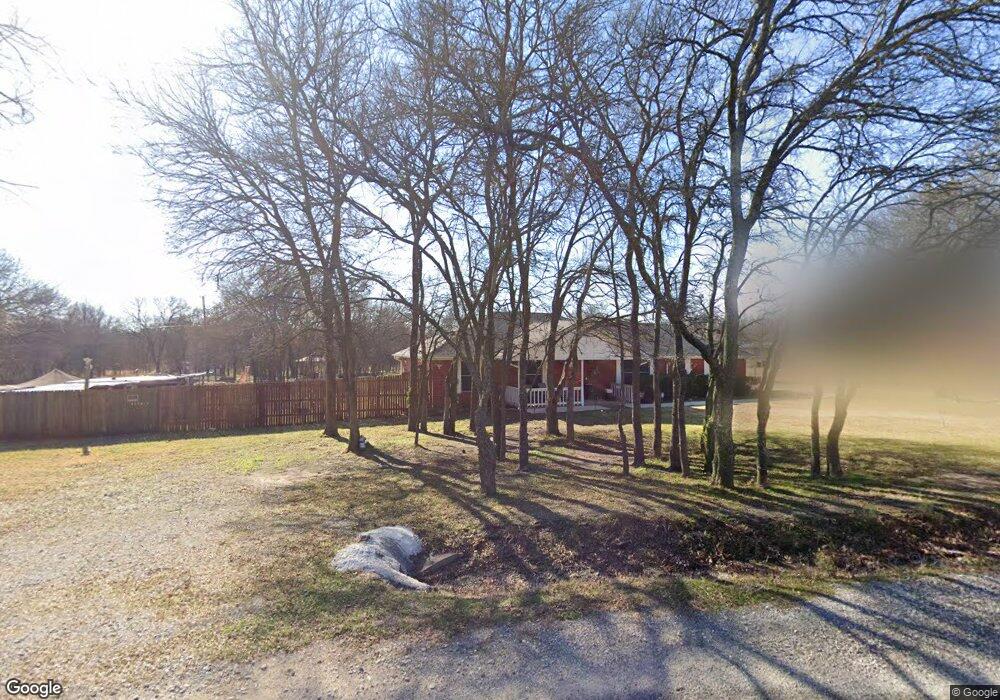
236 Mountain Climb Rd Sherman, TX 75092
Estimated Value: $249,015 - $311,000
3
Beds
2
Baths
1,260
Sq Ft
$215/Sq Ft
Est. Value
About This Home
This home is located at 236 Mountain Climb Rd, Sherman, TX 75092 and is currently estimated at $270,754, approximately $214 per square foot. 236 Mountain Climb Rd is a home located in Grayson County with nearby schools including Percy W. Neblett Elementary School, Dillingham Intermediate School, and Piner Middle School.
Ownership History
Date
Name
Owned For
Owner Type
Purchase Details
Closed on
Dec 20, 2011
Sold by
Ramey Regina and Ramey Koury
Bought by
Frucci David R and Frucci Amy I
Current Estimated Value
Home Financials for this Owner
Home Financials are based on the most recent Mortgage that was taken out on this home.
Original Mortgage
$98,439
Outstanding Balance
$67,404
Interest Rate
4.03%
Mortgage Type
FHA
Estimated Equity
$203,350
Purchase Details
Closed on
Dec 5, 2006
Sold by
Fannie Mae
Bought by
Ramey Regina and Ramey Koury
Home Financials for this Owner
Home Financials are based on the most recent Mortgage that was taken out on this home.
Original Mortgage
$75,510
Interest Rate
6.41%
Mortgage Type
Purchase Money Mortgage
Purchase Details
Closed on
Oct 3, 2006
Sold by
Singleton Douglas W and Singleton Theresa L
Bought by
Federal National Mortgage Association
Create a Home Valuation Report for This Property
The Home Valuation Report is an in-depth analysis detailing your home's value as well as a comparison with similar homes in the area
Home Values in the Area
Average Home Value in this Area
Purchase History
| Date | Buyer | Sale Price | Title Company |
|---|---|---|---|
| Frucci David R | -- | Red River Title Co | |
| Ramey Regina | -- | Chapin Title Co Inc | |
| Federal National Mortgage Association | $71,378 | None Available |
Source: Public Records
Mortgage History
| Date | Status | Borrower | Loan Amount |
|---|---|---|---|
| Open | Frucci David R | $98,439 | |
| Previous Owner | Ramey Regina | $75,510 |
Source: Public Records
Tax History Compared to Growth
Tax History
| Year | Tax Paid | Tax Assessment Tax Assessment Total Assessment is a certain percentage of the fair market value that is determined by local assessors to be the total taxable value of land and additions on the property. | Land | Improvement |
|---|---|---|---|---|
| 2025 | $2,650 | $237,889 | $73,221 | $164,668 |
| 2024 | $4,050 | $239,808 | $0 | $0 |
| 2023 | $2,283 | $218,007 | $0 | $0 |
| 2022 | $3,721 | $198,188 | $0 | $0 |
| 2021 | $3,643 | $190,602 | $29,030 | $161,572 |
| 2020 | $3,506 | $173,023 | $29,030 | $143,993 |
| 2019 | $3,385 | $166,486 | $10,660 | $155,826 |
| 2018 | $2,826 | $165,510 | $10,660 | $154,850 |
| 2017 | $2,586 | $151,725 | $10,660 | $141,065 |
| 2016 | $2,351 | $111,872 | $10,660 | $101,212 |
| 2015 | $0 | $102,790 | $10,660 | $92,130 |
| 2014 | -- | $97,625 | $10,660 | $86,965 |
Source: Public Records
Map
Nearby Homes
- 2524 Mountain Climb Rd
- 147 Shadow Trail
- 4800 N Fm-1417
- 3376 Plainview Rd
- TBD 87 Acres Reynolds Ln
- 2819 Cedar Ridge
- 2812 Fawnwood Ct
- Birchwood G Plan at Canyon Creek Estates
- Telford G Plan at Canyon Creek Estates
- Chesterfield G Plan at Canyon Creek Estates
- Foxleigh G Plan at Canyon Creek Estates
- Millbeck G Plan at Canyon Creek Estates
- Royston G Plan at Canyon Creek Estates
- Appleton G Plan at Canyon Creek Estates
- Ramsey G Plan at Canyon Creek Estates
- Fleetwood G Plan at Canyon Creek Estates
- Canterbury G Plan at Canyon Creek Estates
- Stanley G Plan at Canyon Creek Estates
- 3205 Mimosa Dr
- 10 Pershing Dr Unit A
- 258 Mountain Climb Rd
- 292 Mountain Climb Rd
- 522 High Country Rd
- 201 Mountain Climb Rd
- 186 Mountain Climb Rd
- 494 High Country Rd
- 169 Mountain Climb Rd
- 319 Mountain Climb Rd
- 478 High Country Rd
- 156 Mountain Climb Rd
- 147 Mountain Climb Rd
- 367 Mountain Climb Rd
- 466 High Country Rd
- 128 Mountain Climb Rd
- 460 Mountain Climb Rd
- 123 Mountain Climb Rd
- 407 Mountain Climb Rd
- 438 High Country Rd
- 90 Mountain Climb Rd
- 79 Mountain Climb Rd