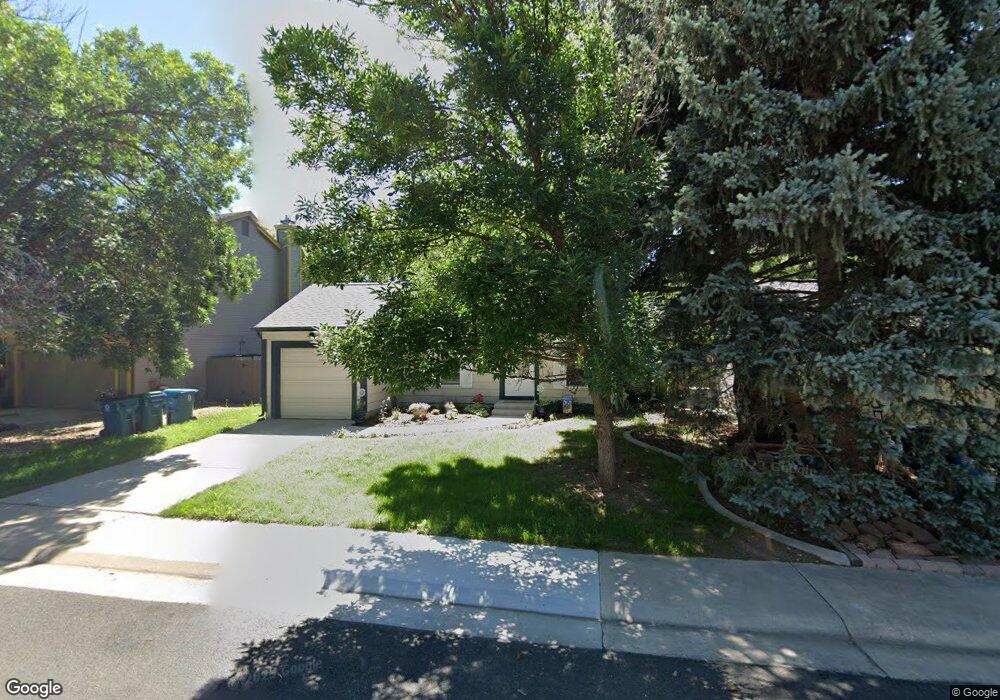
236 S Cleveland Ave Louisville, CO 80027
Estimated Value: $676,694 - $784,000
3
Beds
1
Bath
912
Sq Ft
$818/Sq Ft
Est. Value
About This Home
This home is located at 236 S Cleveland Ave, Louisville, CO 80027 and is currently estimated at $745,674, approximately $817 per square foot. 236 S Cleveland Ave is a home located in Boulder County with nearby schools including Fireside Elementary School, Monarch K-8 School, and Monarch High School.
Ownership History
Date
Name
Owned For
Owner Type
Purchase Details
Closed on
Sep 11, 2020
Sold by
Wardell Kathryn U and Wardell Robert J
Bought by
235 S Cleveland Llc
Current Estimated Value
Purchase Details
Closed on
Aug 4, 1997
Sold by
Moore Leslie A
Bought by
Wardell Kathryn U
Home Financials for this Owner
Home Financials are based on the most recent Mortgage that was taken out on this home.
Original Mortgage
$89,900
Interest Rate
7.6%
Purchase Details
Closed on
Sep 22, 1995
Sold by
Sheveland Mark W and Sheveland Elizabeth L
Bought by
Moore Leslie A
Home Financials for this Owner
Home Financials are based on the most recent Mortgage that was taken out on this home.
Original Mortgage
$100,000
Interest Rate
7.5%
Purchase Details
Closed on
Feb 27, 1987
Bought by
Wardell Kathryn U and Wardell Robert J
Purchase Details
Closed on
Sep 19, 1986
Bought by
Wardell Kathryn U and Wardell Robert J
Create a Home Valuation Report for This Property
The Home Valuation Report is an in-depth analysis detailing your home's value as well as a comparison with similar homes in the area
Home Values in the Area
Average Home Value in this Area
Purchase History
| Date | Buyer | Sale Price | Title Company |
|---|---|---|---|
| 235 S Cleveland Llc | -- | None Available | |
| Wardell Kathryn U | $156,900 | Land Title | |
| Moore Leslie A | $145,000 | -- | |
| Wardell Kathryn U | -- | -- | |
| Wardell Kathryn U | -- | -- |
Source: Public Records
Mortgage History
| Date | Status | Borrower | Loan Amount |
|---|---|---|---|
| Previous Owner | Wardell Kathryn U | $89,900 | |
| Previous Owner | Moore Leslie A | $100,000 |
Source: Public Records
Tax History Compared to Growth
Tax History
| Year | Tax Paid | Tax Assessment Tax Assessment Total Assessment is a certain percentage of the fair market value that is determined by local assessors to be the total taxable value of land and additions on the property. | Land | Improvement |
|---|---|---|---|---|
| 2025 | $3,605 | $40,982 | $16,463 | $24,519 |
| 2024 | $3,605 | $40,982 | $16,463 | $24,519 |
| 2023 | $3,544 | $40,113 | $17,413 | $26,385 |
| 2022 | $3,009 | $31,268 | $12,649 | $18,619 |
| 2021 | $3,238 | $34,964 | $14,143 | $20,821 |
| 2020 | $2,961 | $31,639 | $11,440 | $20,199 |
| 2019 | $2,919 | $31,639 | $11,440 | $20,199 |
| 2018 | $2,349 | $26,294 | $7,632 | $18,662 |
| 2017 | $2,302 | $29,070 | $8,438 | $20,632 |
| 2016 | $2,294 | $26,069 | $9,154 | $16,915 |
| 2015 | $2,174 | $22,463 | $12,338 | $10,125 |
| 2014 | $1,921 | $22,463 | $12,338 | $10,125 |
Source: Public Records
Map
Nearby Homes
- 641 W Dahlia St
- 159 S Polk Ave
- 284 S Taft Ct Unit 76
- 539 Coal Creek Ln
- 362 S Taft Ct Unit 108
- 279 S Taft Ct Unit 53
- 323 S Taft Ct Unit 26
- 305 S Taft Ct Unit 33
- 567 Manorwood Ln
- 203 Springs Dr
- 749 Apple Ct
- 118 S Tanager Ct
- 408 Fillmore Ct
- 291 W Sycamore Ln
- 812 W Mulberry St
- 494 Owl Dr Unit 4
- 592 Spruce Cir
- 546 Ridgeview Dr
- 572 Ridgeview Dr
- 620 Ridgeview Dr
- 240 S Cleveland Ave
- 234 S Cleveland Ave
- 244 S Cleveland Ave
- 230 S Cleveland Ave
- 241 S Cleveland Ave
- 248 S Cleveland Ave
- 245 S Cleveland Ave
- 252 S Buchanan Cir
- 239 S Cleveland Ave
- 224 S Cleveland Ave
- 287 S Madison Ave
- 237 S Cleveland Ave
- 266 S Buchanan Cir
- 225 S Tyler Ave
- 231 S Cleveland Ave
- 285 S Madison Ave
- 233 S Cleveland Ave
- 288 S Madison Ave
- 221 S Tyler Ave
- 270 S Buchanan Cir