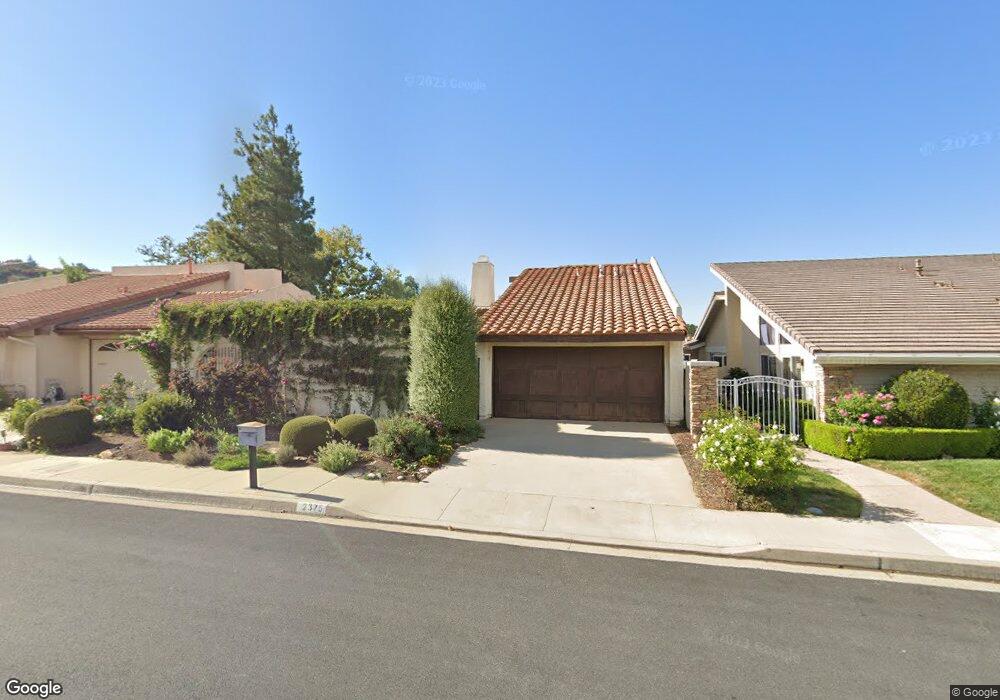
2375 Leeward Cir Westlake Village, CA 91361
Estimated Value: $1,497,488 - $2,194,000
2
Beds
2
Baths
1,609
Sq Ft
$1,187/Sq Ft
Est. Value
About This Home
This home is located at 2375 Leeward Cir, Westlake Village, CA 91361 and is currently estimated at $1,910,622, approximately $1,187 per square foot. 2375 Leeward Cir is a home located in Ventura County with nearby schools including Westlake Elementary School, Colina Middle School, and Westlake High School.
Ownership History
Date
Name
Owned For
Owner Type
Purchase Details
Closed on
Aug 11, 2020
Sold by
Drews Susan T
Bought by
Drews Susan T and Drews Family Trust
Current Estimated Value
Purchase Details
Closed on
Aug 20, 2007
Sold by
Drews Susan Tonai
Bought by
Drews Susan Tonai
Home Financials for this Owner
Home Financials are based on the most recent Mortgage that was taken out on this home.
Original Mortgage
$294,000
Interest Rate
6.42%
Mortgage Type
New Conventional
Purchase Details
Closed on
Nov 28, 2000
Sold by
Drews James E
Bought by
Drews Susan Tonai
Purchase Details
Closed on
Apr 26, 1994
Sold by
Sigalow Lenny and Sigalow Ella
Bought by
Drews James E and Drews Susan Tonai
Home Financials for this Owner
Home Financials are based on the most recent Mortgage that was taken out on this home.
Original Mortgage
$311,400
Interest Rate
4.87%
Create a Home Valuation Report for This Property
The Home Valuation Report is an in-depth analysis detailing your home's value as well as a comparison with similar homes in the area
Home Values in the Area
Average Home Value in this Area
Purchase History
| Date | Buyer | Sale Price | Title Company |
|---|---|---|---|
| Drews Susan T | -- | None Available | |
| Drews Susan Tonai | -- | First American Title Ins Co | |
| Drews Susan Tonai | -- | -- | |
| Drews James E | $346,000 | Chicago Title Co |
Source: Public Records
Mortgage History
| Date | Status | Borrower | Loan Amount |
|---|---|---|---|
| Closed | Drews Susan Tonai | $294,000 | |
| Closed | Drews James E | $311,400 |
Source: Public Records
Tax History Compared to Growth
Tax History
| Year | Tax Paid | Tax Assessment Tax Assessment Total Assessment is a certain percentage of the fair market value that is determined by local assessors to be the total taxable value of land and additions on the property. | Land | Improvement |
|---|---|---|---|---|
| 2025 | $7,690 | $594,861 | $237,943 | $356,918 |
| 2024 | $7,690 | $583,198 | $233,278 | $349,920 |
| 2023 | $7,441 | $571,763 | $228,704 | $343,059 |
| 2022 | $7,163 | $560,552 | $224,219 | $336,333 |
| 2021 | $6,910 | $549,561 | $219,822 | $329,739 |
| 2020 | $6,706 | $543,928 | $217,569 | $326,359 |
| 2019 | $6,441 | $533,263 | $213,303 | $319,960 |
| 2018 | $6,264 | $522,808 | $209,121 | $313,687 |
| 2017 | $6,097 | $512,558 | $205,021 | $307,537 |
| 2016 | $6,005 | $502,508 | $201,001 | $301,507 |
| 2015 | $5,872 | $494,962 | $197,983 | $296,979 |
| 2014 | $5,761 | $485,267 | $194,105 | $291,162 |
Source: Public Records
Map
Nearby Homes
- 3827 Mainsail Cir
- 1885 Fallview Rd
- 3808 Charthouse Cir
- 2546 Oakshore Dr
- 2567 Oakshore Dr
- 1248 Clippers Cir Unit 51
- 2214 Windbrook Ct
- 2270 Portola Ln
- 32200 Oakshore Dr
- 32300 Blue Rock Ridge
- 4008 Mariner Cir
- 32377 Lake Pleasant Dr
- 1321 Bluesail Cir
- 3708 Brigantine Cir
- 1228 S Westlake Blvd Unit B
- 32636 Bowman Knoll Dr
- 1275 Westwind Cir
- 1218 S Westlake Blvd Unit A
- 1985 Highgate Rd
- 1222 S Westlake Blvd Unit B
- 2371 Leeward Cir
- 2379 Leeward Cir
- 2383 Leeward Cir
- 2367 Leeward Cir
- 2387 Leeward Cir
- 2363 Leeward Cir
- 2370 Leeward Cir
- 2366 Leeward Cir
- 2362 Leeward Cir
- 2364 Topsail Cir
- 2374 Leeward Cir
- 2360 Topsail Cir
- 2391 Leeward Cir
- 2368 Topsail Cir
- 2359 Leeward Cir
- 2378 Leeward Cir
- 2358 Leeward Cir
- 2354 Topsail Cir
- 2372 Topsail Cir
- 2354 Leeward Cir