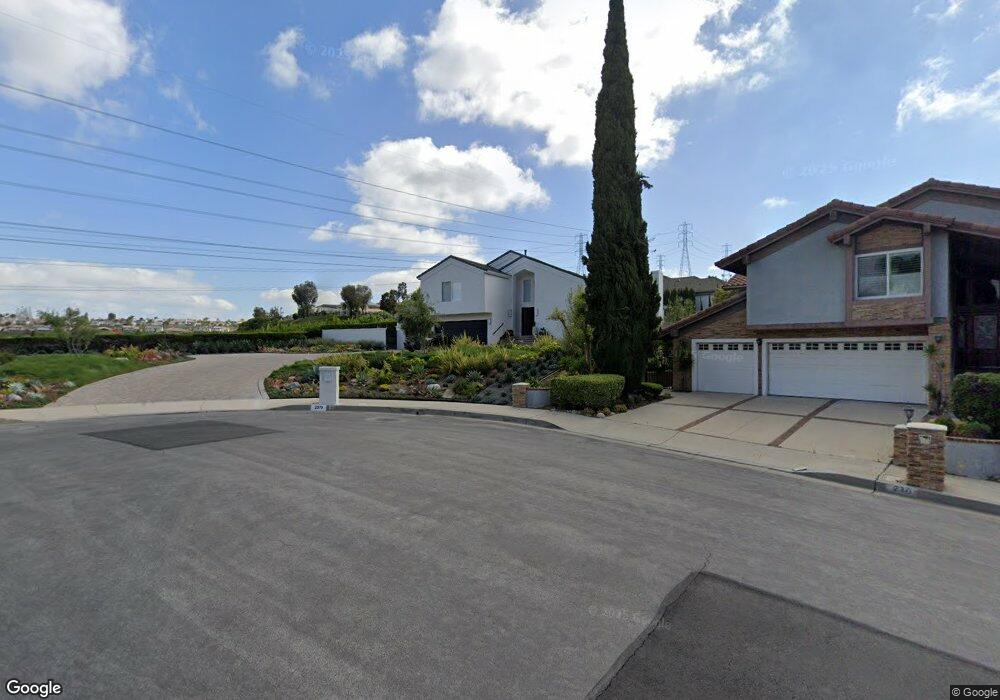
2379 N Rockridge Cir Orange, CA 92867
Estimated Value: $1,787,000 - $2,123,000
3
Beds
3
Baths
3,062
Sq Ft
$621/Sq Ft
Est. Value
About This Home
This home is located at 2379 N Rockridge Cir, Orange, CA 92867 and is currently estimated at $1,901,965, approximately $621 per square foot. 2379 N Rockridge Cir is a home located in Orange County with nearby schools including Serrano Elementary School, Cerro Villa Middle School, and Villa Park High School.
Ownership History
Date
Name
Owned For
Owner Type
Purchase Details
Closed on
Sep 1, 2017
Sold by
Arnold Steven E and Arnold Deena L
Bought by
Arnold Steven E and Arnold Deena L
Current Estimated Value
Purchase Details
Closed on
Oct 20, 1997
Sold by
Armand Cruz and Armand Carmen J
Bought by
Arnold Steven E and Arnold Deena Lincoff
Home Financials for this Owner
Home Financials are based on the most recent Mortgage that was taken out on this home.
Original Mortgage
$302,000
Interest Rate
7.23%
Purchase Details
Closed on
Nov 2, 1995
Sold by
Cruz Armand and Cruz Carmen J
Bought by
Cruz Armand and Cruz Carmen J
Home Financials for this Owner
Home Financials are based on the most recent Mortgage that was taken out on this home.
Original Mortgage
$275,000
Interest Rate
7.87%
Create a Home Valuation Report for This Property
The Home Valuation Report is an in-depth analysis detailing your home's value as well as a comparison with similar homes in the area
Home Values in the Area
Average Home Value in this Area
Purchase History
| Date | Buyer | Sale Price | Title Company |
|---|---|---|---|
| Arnold Steven E | -- | None Available | |
| Arnold Steven E | -- | None Available | |
| Arnold Steven E | $377,500 | Gateway Title Company | |
| Cruz Armand | -- | Gateway Title |
Source: Public Records
Mortgage History
| Date | Status | Borrower | Loan Amount |
|---|---|---|---|
| Previous Owner | Arnold Steven E | $302,000 | |
| Previous Owner | Cruz Armand | $275,000 | |
| Closed | Arnold Steven E | $37,750 |
Source: Public Records
Tax History Compared to Growth
Tax History
| Year | Tax Paid | Tax Assessment Tax Assessment Total Assessment is a certain percentage of the fair market value that is determined by local assessors to be the total taxable value of land and additions on the property. | Land | Improvement |
|---|---|---|---|---|
| 2025 | $6,640 | $602,772 | $220,869 | $381,903 |
| 2024 | $6,640 | $590,953 | $216,538 | $374,415 |
| 2023 | $6,494 | $579,366 | $212,292 | $367,074 |
| 2022 | $6,368 | $568,006 | $208,129 | $359,877 |
| 2021 | $6,191 | $556,869 | $204,048 | $352,821 |
| 2020 | $6,134 | $551,159 | $201,955 | $349,204 |
| 2019 | $6,057 | $540,352 | $197,995 | $342,357 |
| 2018 | $5,965 | $529,757 | $194,112 | $335,645 |
| 2017 | $5,718 | $519,370 | $190,306 | $329,064 |
| 2016 | $5,608 | $509,187 | $186,575 | $322,612 |
| 2015 | $5,527 | $501,539 | $183,772 | $317,767 |
| 2014 | $5,409 | $491,715 | $180,172 | $311,543 |
Source: Public Records
Map
Nearby Homes
- 2326 N Rockridge Cir
- 18262 Pamela Place
- 2421 N Feather Hill Dr
- 9631 James Cir
- 3216 E Ridgeway Rd
- 18671 Valley Dr
- 18675 Valley Dr
- 18732 Monte Vista Cir
- 3148 E East Abbey Ln
- 18781 Peppertree Dr
- 18782 Peppertree Dr
- 4410 E Ardmore St
- 9451 Brewer Way
- 4330 E Cornwall Ave
- 18471 Hillcrest Ave
- 2710 E Vista Ridge Dr
- 18808 Canyon Crest Dr
- 3211 E Mandeville Place
- 18677 Mesa Dr
- 18852 Canyon Crest Dr
- 2371 N Rockridge Cir
- 3737 E Rolling Green Ln
- 3738 E Rolling Green Ln
- 2359 N Rockridge Cir
- 2376 N Rockridge Cir
- 3741 E Rolling Green Ln
- 2364 N Rockridge Cir
- 3742 E Rolling Green Ln
- 2345 N Rockridge Cir
- 2348 N Rockridge Cir
- 3801 E Rolling Green Ln
- 3746 E Rolling Green Ln
- 2333 N Rockridge Cir
- 3802 E Rolling Green Ln
- 3811 E Rolling Green Ln
- 2342 N Rockridge Cir
- 3815 E Summitridge Ln
- 3807 E Summitridge Ln
- 3823 E Summitridge Ln
- 2346 N Rockridge Cir