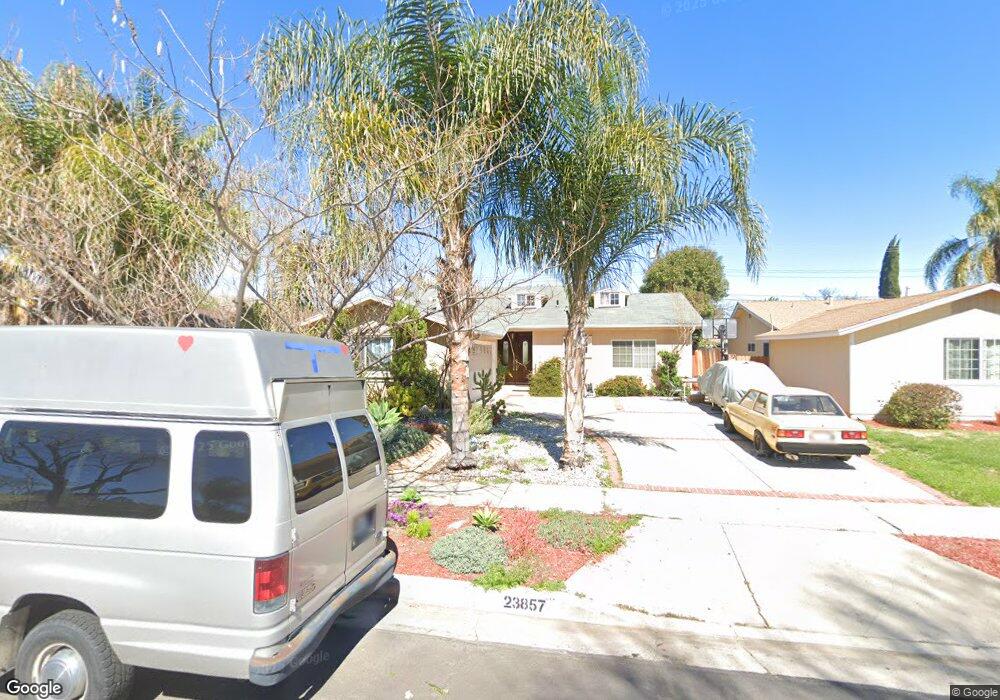
23857 Friar St Woodland Hills, CA 91367
Estimated Value: $995,552 - $1,190,000
3
Beds
3
Baths
1,658
Sq Ft
$672/Sq Ft
Est. Value
About This Home
This home is located at 23857 Friar St, Woodland Hills, CA 91367 and is currently estimated at $1,113,638, approximately $671 per square foot. 23857 Friar St is a home located in Los Angeles County with nearby schools including Lockhurst Drive Charter Elementary, Haynes Charter For Enriched Studies, and Woodlake Elementary Community Charter.
Ownership History
Date
Name
Owned For
Owner Type
Purchase Details
Closed on
Oct 15, 2024
Sold by
Ayala Farnous and Ayala Kourosh Farnoush
Bought by
Farnoush Family Trust and Farnoush
Current Estimated Value
Purchase Details
Closed on
Nov 22, 2019
Sold by
Farnoush Kourosh and Farnoush Ayala
Bought by
Farnoush Kourosh and Farnoush Ayala
Home Financials for this Owner
Home Financials are based on the most recent Mortgage that was taken out on this home.
Original Mortgage
$430,000
Interest Rate
3.6%
Mortgage Type
New Conventional
Purchase Details
Closed on
Sep 11, 1995
Sold by
Rand Hilda M
Bought by
Farnoush Kourosh
Home Financials for this Owner
Home Financials are based on the most recent Mortgage that was taken out on this home.
Original Mortgage
$135,900
Interest Rate
7.59%
Create a Home Valuation Report for This Property
The Home Valuation Report is an in-depth analysis detailing your home's value as well as a comparison with similar homes in the area
Home Values in the Area
Average Home Value in this Area
Purchase History
| Date | Buyer | Sale Price | Title Company |
|---|---|---|---|
| Farnoush Family Trust | -- | None Listed On Document | |
| Farnoush Kourosh | -- | Lawyers Title Company La | |
| Farnoush Kourosh | $274,545 | First American Title |
Source: Public Records
Mortgage History
| Date | Status | Borrower | Loan Amount |
|---|---|---|---|
| Previous Owner | Farnoush Kourosh | $430,000 | |
| Previous Owner | Farnoush Kourosh | $135,900 |
Source: Public Records
Tax History Compared to Growth
Tax History
| Year | Tax Paid | Tax Assessment Tax Assessment Total Assessment is a certain percentage of the fair market value that is determined by local assessors to be the total taxable value of land and additions on the property. | Land | Improvement |
|---|---|---|---|---|
| 2025 | $4,004 | $315,912 | $164,452 | $151,460 |
| 2024 | $4,004 | $309,719 | $161,228 | $148,491 |
| 2023 | $3,930 | $303,647 | $158,067 | $145,580 |
| 2022 | $3,754 | $297,694 | $154,968 | $142,726 |
| 2021 | $3,701 | $291,858 | $151,930 | $139,928 |
| 2019 | $3,594 | $283,204 | $147,425 | $135,779 |
| 2018 | $3,488 | $277,652 | $144,535 | $133,117 |
| 2016 | $3,319 | $266,872 | $138,923 | $127,949 |
| 2015 | $3,272 | $262,865 | $136,837 | $126,028 |
| 2014 | $3,289 | $257,717 | $134,157 | $123,560 |
Source: Public Records
Map
Nearby Homes
- 6416 Kenwater Place
- 6236 Kenwater Ave
- 24017 Sylvan St
- 6153 Debs Ave
- 23812 Calvert St
- 23549 Victory Blvd Unit 21
- 24208 Gilmore St
- 6544 Sheltondale Ave
- 23928 Archwood St
- 6172 Dalecrest Ave
- 24244 Friar St
- 6022 Elba Place
- 6670 Platt Ave
- 6227 Glide Ave
- 23432 Victory Blvd
- 5929 Adler Ave
- 6001 Manton Ave
- 6009 Neddy Ave
- 24221 Aetna St
- 5931 Neddy Ave
- 23855 Friar St
- 23863 Friar St
- 23851 Friar St
- 23869 Friar St
- 23845 Friar St
- 23862 Victory Blvd
- 23856 Victory Blvd
- 23868 Victory Blvd
- 23901 Friar St
- 23860 Friar St
- 23839 Friar St
- 23850 Victory Blvd
- 23900 Victory Blvd
- 23854 Friar St
- 23866 Friar St
- 23848 Friar St
- 23844 Victory Blvd
- 23906 Victory Blvd
- 23842 Friar St
- 23907 Friar St