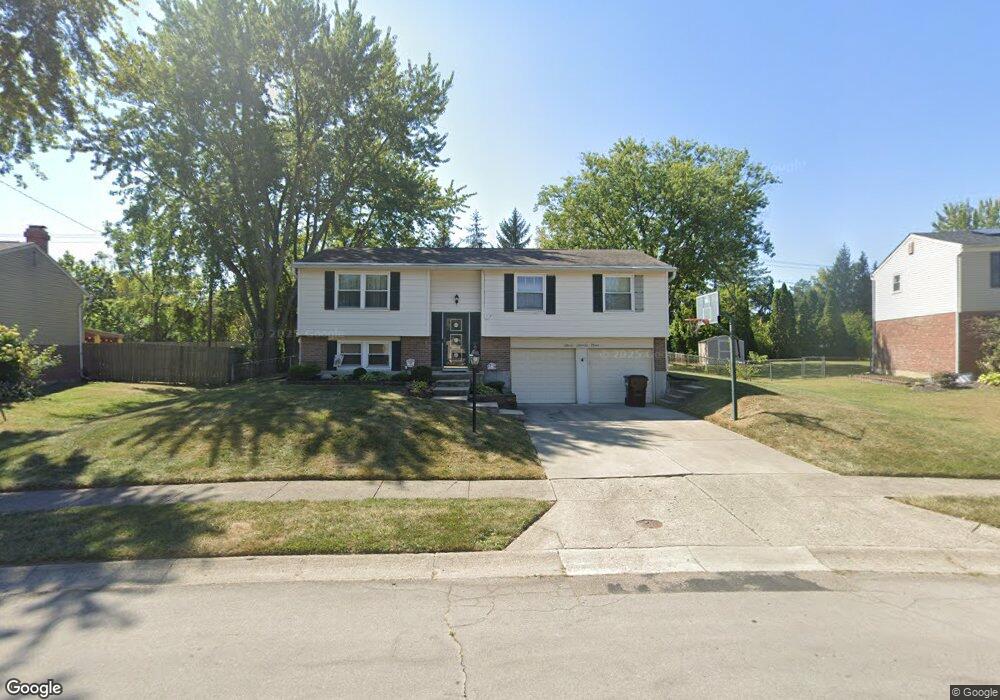
239 Porter Dr Englewood, OH 45322
Estimated Value: $221,000 - $234,037
3
Beds
2
Baths
1,138
Sq Ft
$199/Sq Ft
Est. Value
About This Home
This home is located at 239 Porter Dr, Englewood, OH 45322 and is currently estimated at $226,009, approximately $198 per square foot. 239 Porter Dr is a home located in Montgomery County with nearby schools including Englewood Hills Elementary School, Northmont High School, and Trotwood Preparatory & Fitness Academy.
Ownership History
Date
Name
Owned For
Owner Type
Purchase Details
Closed on
Mar 4, 2011
Sold by
Humphrey Debra Y and Humphrey Eric L
Bought by
Humphrey Debra Y
Current Estimated Value
Purchase Details
Closed on
Nov 29, 2001
Sold by
Humphrey Debra Y
Bought by
Humphrey Eric L and Humphrey Debra Y
Purchase Details
Closed on
Oct 28, 1996
Sold by
Albright Sandra J
Bought by
Humphrey Debra Y
Create a Home Valuation Report for This Property
The Home Valuation Report is an in-depth analysis detailing your home's value as well as a comparison with similar homes in the area
Home Values in the Area
Average Home Value in this Area
Purchase History
| Date | Buyer | Sale Price | Title Company |
|---|---|---|---|
| Humphrey Debra Y | -- | Attorney | |
| Humphrey Eric L | -- | -- | |
| Humphrey Debra Y | $88,500 | -- |
Source: Public Records
Tax History Compared to Growth
Tax History
| Year | Tax Paid | Tax Assessment Tax Assessment Total Assessment is a certain percentage of the fair market value that is determined by local assessors to be the total taxable value of land and additions on the property. | Land | Improvement |
|---|---|---|---|---|
| 2024 | $3,391 | $59,450 | $13,120 | $46,330 |
| 2023 | $3,391 | $59,450 | $13,120 | $46,330 |
| 2022 | $3,098 | $41,800 | $9,240 | $32,560 |
| 2021 | $3,107 | $41,800 | $9,240 | $32,560 |
| 2020 | $3,049 | $41,800 | $9,240 | $32,560 |
| 2019 | $2,638 | $32,380 | $10,630 | $21,750 |
| 2018 | $2,590 | $32,380 | $10,630 | $21,750 |
| 2017 | $2,572 | $32,380 | $10,630 | $21,750 |
| 2016 | $2,505 | $30,980 | $9,240 | $21,740 |
| 2015 | $2,291 | $30,980 | $9,240 | $21,740 |
| 2014 | $2,291 | $30,980 | $9,240 | $21,740 |
| 2012 | -- | $36,730 | $9,240 | $27,490 |
Source: Public Records
Map
Nearby Homes
- 229 Brookwood Dr
- 1017 Terracewood Dr
- 1008 Merrywood Dr
- 1010 Heathwood Dr
- 505 Durst Dr
- 4220 Pleasanton Rd
- 4230 Pleasanton Rd
- 174 Candle Ct Unit 12
- 178 Candle Ct Unit 14
- 510 Lambert Ln
- 4161 Gorman Ave
- 117 Candle Ct Unit 740
- 0 Taywood Rd
- 4329 Gorman Ave
- 4030 Gateway Dr
- 7012 Stillmore Dr
- 717 Woodlawn Ave
- 7000 Kinsey Rd
- 718 Bonnycastle Ave
- 206 Gardengrove Way
- 241 Porter Dr
- 237 Porter Dr
- 237 Brookwood Dr
- 235 Porter Dr
- 226 Porter Dr
- 235 Brookwood Dr
- 228 Porter Dr
- 224 Porter Dr
- 233 Porter Dr
- 1028 Merrywood Dr
- 230 Porter Dr
- 233 Brookwood Dr
- 245 Porter Dr
- 1026 Merrywood Dr
- 231 Porter Dr
- 232 Porter Dr
- 1024 Merrywood Dr
- 222 Brookwood Dr
- 231 Brookwood Dr
- 247 Porter Dr