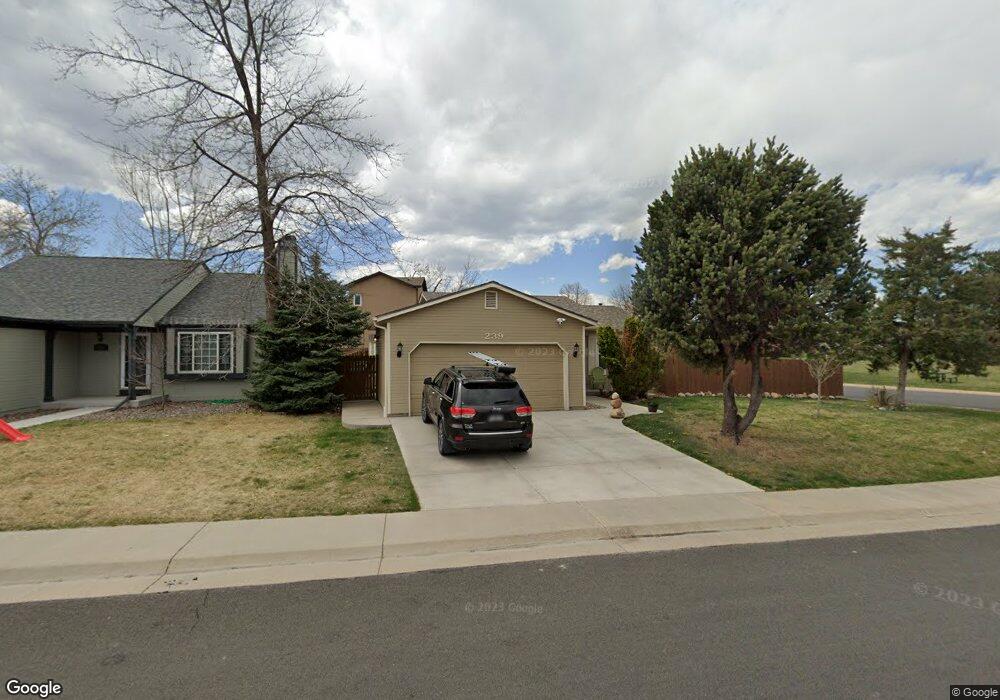
239 S Carter Ave Louisville, CO 80027
Estimated Value: $654,190 - $718,000
2
Beds
2
Baths
808
Sq Ft
$861/Sq Ft
Est. Value
About This Home
This home is located at 239 S Carter Ave, Louisville, CO 80027 and is currently estimated at $695,298, approximately $860 per square foot. 239 S Carter Ave is a home located in Boulder County with nearby schools including Louisville Elementary School, Louisville Middle School, and Monarch High School.
Ownership History
Date
Name
Owned For
Owner Type
Purchase Details
Closed on
Dec 21, 1998
Sold by
Moros Michael R and Morin Jill A
Bought by
Moros Michael R
Current Estimated Value
Home Financials for this Owner
Home Financials are based on the most recent Mortgage that was taken out on this home.
Original Mortgage
$131,250
Outstanding Balance
$31,338
Interest Rate
7.37%
Mortgage Type
Purchase Money Mortgage
Estimated Equity
$663,960
Purchase Details
Closed on
Mar 15, 1996
Sold by
Patton David O and Foster Patton Kathy J
Bought by
Moros Michael R
Home Financials for this Owner
Home Financials are based on the most recent Mortgage that was taken out on this home.
Original Mortgage
$130,010
Interest Rate
7.03%
Purchase Details
Closed on
Oct 1, 1991
Bought by
Moros Michael R
Purchase Details
Closed on
Sep 7, 1983
Bought by
Moros Michael R
Create a Home Valuation Report for This Property
The Home Valuation Report is an in-depth analysis detailing your home's value as well as a comparison with similar homes in the area
Home Values in the Area
Average Home Value in this Area
Purchase History
| Date | Buyer | Sale Price | Title Company |
|---|---|---|---|
| Moros Michael R | -- | -- | |
| Moros Michael R | $131,900 | Commonwealth Land Title | |
| Moros Michael R | $83,000 | -- | |
| Moros Michael R | $73,600 | -- |
Source: Public Records
Mortgage History
| Date | Status | Borrower | Loan Amount |
|---|---|---|---|
| Open | Moros Michael R | $131,250 | |
| Closed | Moros Michael R | $130,010 |
Source: Public Records
Tax History Compared to Growth
Tax History
| Year | Tax Paid | Tax Assessment Tax Assessment Total Assessment is a certain percentage of the fair market value that is determined by local assessors to be the total taxable value of land and additions on the property. | Land | Improvement |
|---|---|---|---|---|
| 2025 | $3,637 | $41,569 | $20,113 | $21,456 |
| 2024 | $3,637 | $41,569 | $20,113 | $21,456 |
| 2023 | $3,576 | $40,468 | $21,293 | $22,860 |
| 2022 | $3,070 | $31,900 | $15,651 | $16,249 |
| 2021 | $3,268 | $35,285 | $17,310 | $17,975 |
| 2020 | $3,099 | $33,112 | $16,302 | $16,810 |
| 2019 | $3,055 | $33,112 | $16,302 | $16,810 |
| 2018 | $2,655 | $29,714 | $9,360 | $20,354 |
| 2017 | $2,602 | $32,851 | $10,348 | $22,503 |
| 2016 | $2,249 | $25,568 | $11,144 | $14,424 |
| 2015 | $2,132 | $22,407 | $12,338 | $10,069 |
| 2014 | $1,916 | $22,407 | $12,338 | $10,069 |
Source: Public Records
Map
Nearby Homes
- 298 S Hoover Ave
- 203 Springs Dr
- 111 Barbara St
- 503 Lois Dr
- 196 Lincoln Cir
- 291 W Sycamore Ln
- 539 Coal Creek Ln
- 567 Manorwood Ln
- 516 Grant Ave
- 159 S Polk Ave
- 641 W Dahlia St
- 474 W Spruce St
- 529 Main St
- 310 W Spruce St
- 408 Fillmore Ct
- TBD L12 County Rd 255
- TBD L14 County Rd 255
- TBD L2 County Rd 255
- TBD L8 County Rd 255
- 380 County Rd
- 251 S Carter Ave
- 246 S Adams Dr
- 265 S Carter Ave
- 230 S Carter Ave
- 260 S Adams Dr
- 240 S Carter Ave
- 264 S Carter Ave
- 277 S Carter Ave
- 270 S Carter Ave
- 276 S Adams Dr
- 190 Dahlia Dr
- 253 S Adams Dr
- 286 S Carter Ave
- 289 S Carter Ave
- 296 S Adams Dr
- 267 S Monroe Ct
- 275 S Monroe Ct
- 269 S Adams Dr
- 212 Dahlia Dr
- 287 S Adams Dr