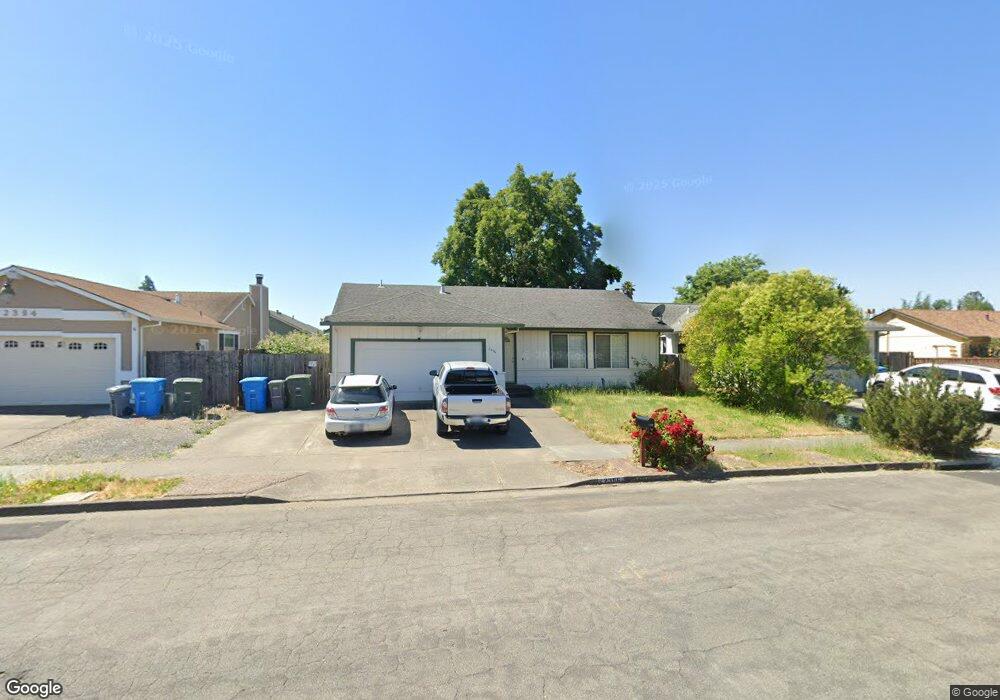
2396 Valley West Dr Santa Rosa, CA 95401
Copperfield NeighborhoodEstimated Value: $579,297 - $663,000
3
Beds
2
Baths
1,148
Sq Ft
$544/Sq Ft
Est. Value
About This Home
This home is located at 2396 Valley West Dr, Santa Rosa, CA 95401 and is currently estimated at $624,324, approximately $543 per square foot. 2396 Valley West Dr is a home located in Sonoma County with nearby schools including Elsie Allen High School, Wright Charter, and College Oak Montessori School.
Ownership History
Date
Name
Owned For
Owner Type
Purchase Details
Closed on
May 31, 2011
Sold by
Bac Home Loans Servicing Lp
Bought by
Thompson Douglas
Current Estimated Value
Home Financials for this Owner
Home Financials are based on the most recent Mortgage that was taken out on this home.
Original Mortgage
$170,395
Outstanding Balance
$117,467
Interest Rate
4.63%
Mortgage Type
New Conventional
Estimated Equity
$506,857
Purchase Details
Closed on
Jan 28, 2011
Sold by
Antognini Audra and Cavallero Anthony
Bought by
Bac Home Loans Servicing Lp and Countrywide Home Loans Servicing Lp
Purchase Details
Closed on
Jul 14, 2004
Sold by
Keith Thomas P and Truax Keith Hetty
Bought by
Antognini Audra and Cavallero Anthony
Home Financials for this Owner
Home Financials are based on the most recent Mortgage that was taken out on this home.
Original Mortgage
$336,000
Interest Rate
5.5%
Mortgage Type
Purchase Money Mortgage
Create a Home Valuation Report for This Property
The Home Valuation Report is an in-depth analysis detailing your home's value as well as a comparison with similar homes in the area
Home Values in the Area
Average Home Value in this Area
Purchase History
| Date | Buyer | Sale Price | Title Company |
|---|---|---|---|
| Thompson Douglas | $220,500 | First American Title Company | |
| Bac Home Loans Servicing Lp | $213,300 | Accommodation | |
| Antognini Audra | $420,000 | North Bay Title Co |
Source: Public Records
Mortgage History
| Date | Status | Borrower | Loan Amount |
|---|---|---|---|
| Open | Thompson Douglas | $170,395 | |
| Previous Owner | Antognini Audra | $336,000 | |
| Closed | Antognini Audra | $84,000 |
Source: Public Records
Tax History Compared to Growth
Tax History
| Year | Tax Paid | Tax Assessment Tax Assessment Total Assessment is a certain percentage of the fair market value that is determined by local assessors to be the total taxable value of land and additions on the property. | Land | Improvement |
|---|---|---|---|---|
| 2025 | $3,223 | $282,234 | $115,302 | $166,932 |
| 2024 | $3,223 | $276,701 | $113,042 | $163,659 |
| 2023 | $3,223 | $271,276 | $110,826 | $160,450 |
| 2022 | $3,042 | $265,957 | $108,653 | $157,304 |
| 2021 | $2,987 | $260,743 | $106,523 | $154,220 |
| 2020 | $2,976 | $258,070 | $105,431 | $152,639 |
| 2019 | $2,950 | $253,011 | $103,364 | $149,647 |
| 2018 | $2,928 | $248,051 | $101,338 | $146,713 |
| 2017 | $2,868 | $243,188 | $99,351 | $143,837 |
| 2016 | $2,838 | $238,420 | $97,403 | $141,017 |
| 2015 | $2,748 | $234,839 | $95,940 | $138,899 |
| 2014 | $2,646 | $230,240 | $94,061 | $136,179 |
Source: Public Records
Map
Nearby Homes
- 2400 Valley Dr W
- 438 Rusty Dr
- 2344 Donahue Ave
- 2353 Hood Ct
- 2333 Pacheco Place
- 337 Westmont Place
- 415 Occidental Cir
- 2315 Cross Ave
- 2305 Cross Ave
- 307 Occidental Cir
- 91 Westgate Cir
- 314 Michael Dr
- 948 Brunello Dr
- 213 Monarch Ct
- 224 Regency Ct
- 226 Regency Ct
- 4077 Louis Krohn Dr
- 2154 Longhorn Cir
- 235 Regency Ct
- 4025 Sebastopol Rd
- 2394 Valley Dr W
- 2398 Valley West Dr
- 2394 Valley West Dr
- 2377 Lemur St
- 2381 Lemur St
- 2400 Valley West Dr
- 2373 Lemur St
- 2392 Valley West Dr
- 2369 Lemur St
- 2385 Lemur St
- 2399 Valley West Dr
- 2395 Valley West Dr
- 2390 Valley Dr W
- 2399 Valley Dr W
- 2390 Valley West Dr
- 2404 Valley West Dr
- 2365 Lemur St
- 2393 Valley West Dr
- 2389 Lemur St
- 2391 Valley Dr W