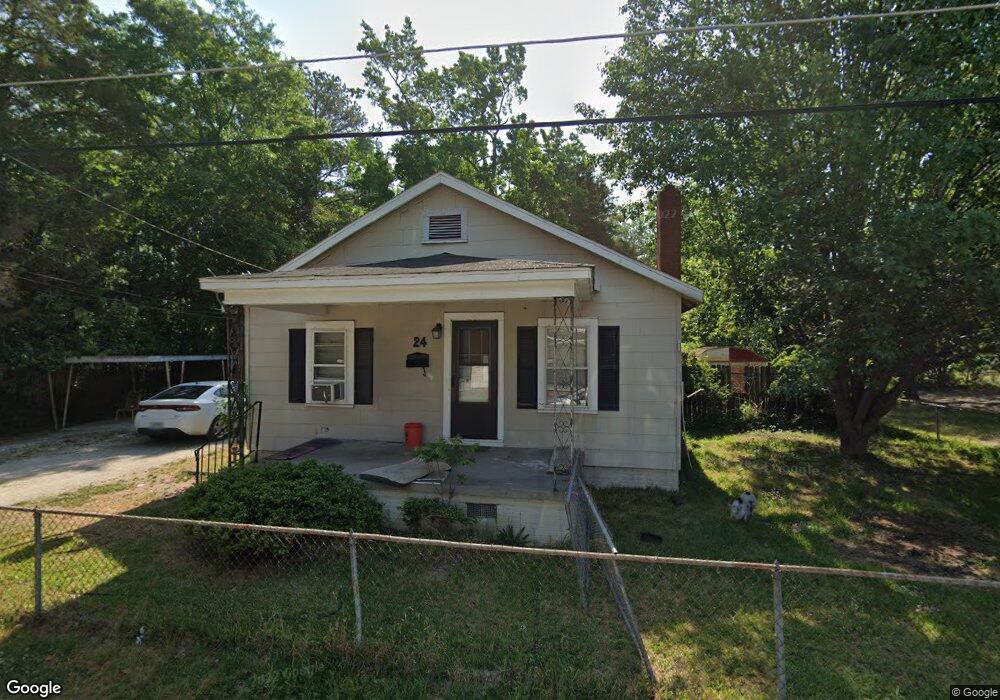
24 Albion St Lumberton, NC 28358
Estimated Value: $45,000 - $86,974
2
Beds
1
Bath
770
Sq Ft
$96/Sq Ft
Est. Value
About This Home
This home is located at 24 Albion St, Lumberton, NC 28358 and is currently estimated at $73,744, approximately $95 per square foot. 24 Albion St is a home located in Robeson County with nearby schools including Tanglewood Elementary School, Parkton Elementary School, and L. Gilbert Carroll Middle School.
Ownership History
Date
Name
Owned For
Owner Type
Purchase Details
Closed on
Sep 5, 2017
Sold by
Terranova Giuseppe and Terranova Beth
Bought by
New Earth Investments Llc
Current Estimated Value
Home Financials for this Owner
Home Financials are based on the most recent Mortgage that was taken out on this home.
Original Mortgage
$124,400
Outstanding Balance
$103,883
Interest Rate
3.9%
Mortgage Type
Future Advance Clause Open End Mortgage
Estimated Equity
-$30,139
Purchase Details
Closed on
Feb 5, 2009
Sold by
Stark Investment Properties Llc
Bought by
Terranova Giuseppe and Terranova Beth
Purchase Details
Closed on
Sep 25, 2008
Sold by
Hardee Nicky Heath and Hardee Robin
Bought by
Stark Investment Properties Llc
Home Financials for this Owner
Home Financials are based on the most recent Mortgage that was taken out on this home.
Original Mortgage
$24,000
Interest Rate
6.49%
Mortgage Type
Future Advance Clause Open End Mortgage
Create a Home Valuation Report for This Property
The Home Valuation Report is an in-depth analysis detailing your home's value as well as a comparison with similar homes in the area
Home Values in the Area
Average Home Value in this Area
Purchase History
| Date | Buyer | Sale Price | Title Company |
|---|---|---|---|
| New Earth Investments Llc | -- | None Available | |
| Terranova Giuseppe | $39,500 | -- | |
| Stark Investment Properties Llc | $30,000 | -- |
Source: Public Records
Mortgage History
| Date | Status | Borrower | Loan Amount |
|---|---|---|---|
| Open | New Earth Investments Llc | $124,400 | |
| Previous Owner | Stark Investment Properties Llc | $24,000 |
Source: Public Records
Tax History Compared to Growth
Tax History
| Year | Tax Paid | Tax Assessment Tax Assessment Total Assessment is a certain percentage of the fair market value that is determined by local assessors to be the total taxable value of land and additions on the property. | Land | Improvement |
|---|---|---|---|---|
| 2025 | $522 | $58,900 | $5,500 | $53,400 |
| 2024 | $517 | $58,900 | $5,500 | $53,400 |
| 2023 | $401 | $43,400 | $5,000 | $38,400 |
| 2022 | $401 | $43,400 | $5,000 | $38,400 |
| 2021 | $401 | $43,400 | $5,000 | $38,400 |
| 2020 | $386 | $43,400 | $5,000 | $38,400 |
| 2018 | $394 | $34,600 | $5,000 | $29,600 |
| 2017 | $326 | $34,600 | $5,000 | $29,600 |
| 2016 | $326 | $34,600 | $5,000 | $29,600 |
| 2015 | $326 | $34,600 | $5,000 | $29,600 |
| 2014 | $326 | $34,600 | $5,000 | $29,600 |
Source: Public Records
Map
Nearby Homes