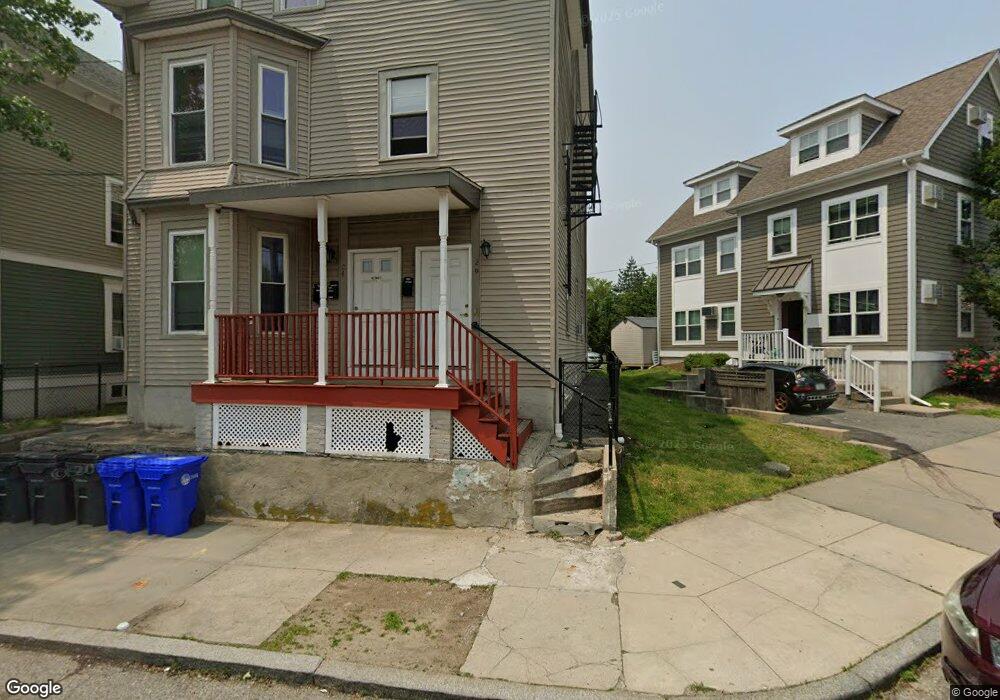
24 Hyat St Providence, RI 02909
Olneyville NeighborhoodEstimated Value: $473,000 - $604,000
9
Beds
3
Baths
3,359
Sq Ft
$160/Sq Ft
Est. Value
About This Home
This home is located at 24 Hyat St, Providence, RI 02909 and is currently estimated at $536,970, approximately $159 per square foot. 24 Hyat St is a home located in Providence County with nearby schools including Asa Messer Elementary School, Charles N. Fortes Elementary School, and Laurel Hill Annex School.
Ownership History
Date
Name
Owned For
Owner Type
Purchase Details
Closed on
Mar 26, 2010
Sold by
Ri Housing Dev Corp
Bought by
Olneyville Housing Cor
Current Estimated Value
Home Financials for this Owner
Home Financials are based on the most recent Mortgage that was taken out on this home.
Original Mortgage
$30,000
Outstanding Balance
$19,981
Interest Rate
5%
Estimated Equity
$516,989
Purchase Details
Closed on
Aug 12, 2009
Sold by
Bank Of America Na
Bought by
Hsng Ri
Purchase Details
Closed on
Dec 18, 2008
Sold by
Odunewu Shakiru
Bought by
Lasalle Bk
Purchase Details
Closed on
Nov 30, 2006
Sold by
Sanusi Minuru A
Bought by
Odunewu Shakiru
Purchase Details
Closed on
Sep 20, 2001
Sold by
Kanj Elias
Bought by
Sarusi Muniru
Create a Home Valuation Report for This Property
The Home Valuation Report is an in-depth analysis detailing your home's value as well as a comparison with similar homes in the area
Home Values in the Area
Average Home Value in this Area
Purchase History
| Date | Buyer | Sale Price | Title Company |
|---|---|---|---|
| Olneyville Housing Cor | $49,500 | -- | |
| Hsng Ri | $49,500 | -- | |
| Lasalle Bk | $78,750 | -- | |
| Odunewu Shakiru | $270,000 | -- | |
| Sarusi Muniru | $63,000 | -- |
Source: Public Records
Mortgage History
| Date | Status | Borrower | Loan Amount |
|---|---|---|---|
| Open | Sarusi Muniru | $30,000 | |
| Open | Sarusi Muniru | $266,500 | |
| Closed | Sarusi Muniru | $49,500 |
Source: Public Records
Tax History Compared to Growth
Tax History
| Year | Tax Paid | Tax Assessment Tax Assessment Total Assessment is a certain percentage of the fair market value that is determined by local assessors to be the total taxable value of land and additions on the property. | Land | Improvement |
|---|---|---|---|---|
| 2025 | $7,958 | $545,100 | $148,000 | $397,100 |
| 2024 | $6,320 | $344,400 | $72,000 | $272,400 |
| 2023 | $6,320 | $344,400 | $72,000 | $272,400 |
| 2022 | $6,130 | $344,400 | $72,000 | $272,400 |
| 2021 | $4,890 | $199,100 | $33,600 | $165,500 |
| 2020 | $4,890 | $199,100 | $33,600 | $165,500 |
| 2019 | $4,890 | $199,100 | $33,600 | $165,500 |
| 2018 | $4,331 | $135,500 | $27,700 | $107,800 |
| 2017 | $0 | $135,500 | $27,700 | $107,800 |
| 2016 | -- | $135,500 | $27,700 | $107,800 |
| 2015 | -- | $117,000 | $33,300 | $83,700 |
| 2014 | $3,891 | $115,300 | $33,300 | $82,000 |
| 2013 | $3,891 | $115,300 | $33,300 | $82,000 |
Source: Public Records
Map
Nearby Homes