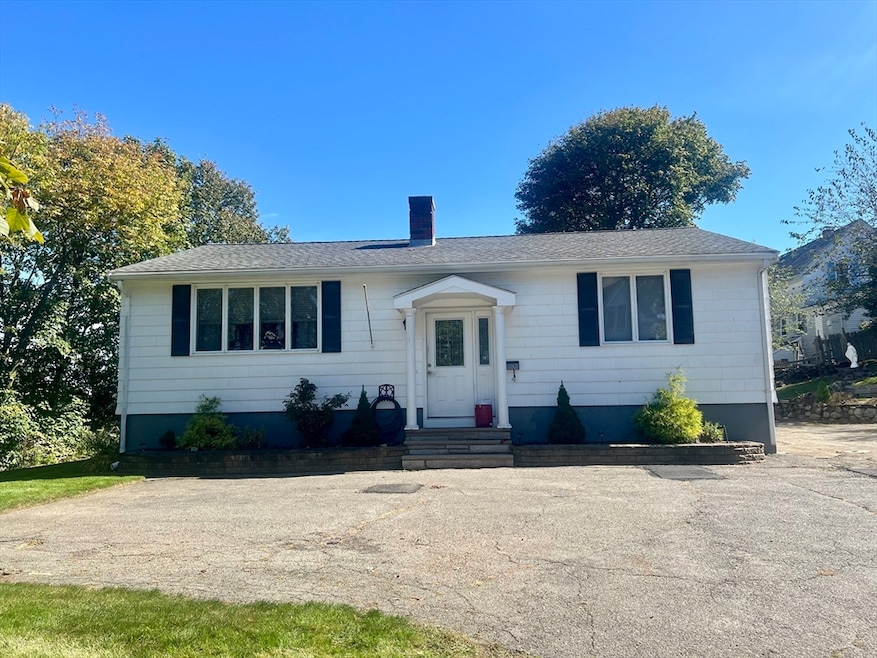
24 Lily St Lynn, MA 01902
Highlands NeighborhoodHighlights
- Medical Services
- Property is near public transit
- 1 Fireplace
- 12,323 Sq Ft lot
- Main Floor Primary Bedroom
- No HOA
About This Home
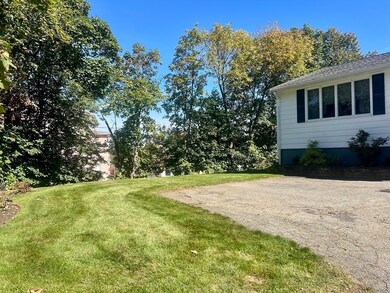
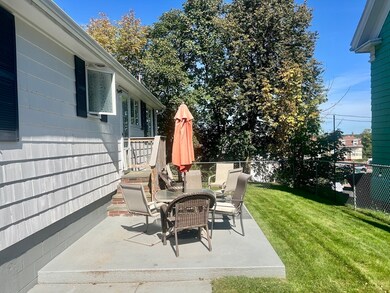
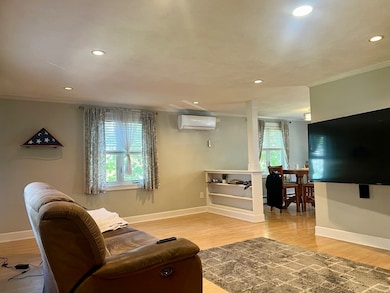
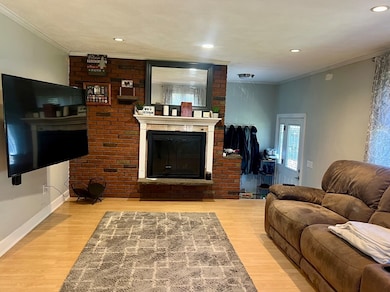
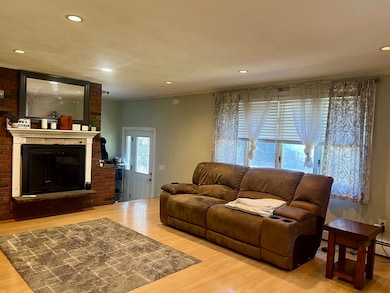
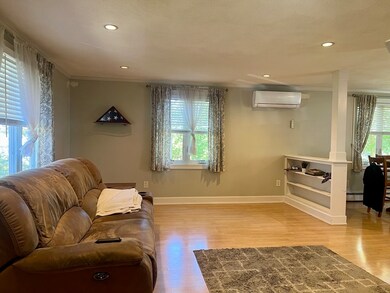
Beautiful Sun Filled One Level Single Family Home For Rent! This Home Features A Large Eat-In-Kitchen, With Plenty Of Cabinets And Counter Space, Stainless Steel Appliances, Spacious Living Room With Fireplace, Two Good Sized Bedrooms With Large Closets, As Well As Full Bath. Additional Features Include, Laundry In Basement, Large Multi Car Driveway For Plenty Of Off Street Parking, Large Lot Offering Fenced Backyard, Big Front Yard And Side Yard, Mini Split Air Conditioning And Gas Heating. Tenant Responsible For All Utilities Including Heat And Water.
Home Details
Home Type
- Single Family
Est. Annual Taxes
- $5,288
Year Built
- Built in 1965
Lot Details
- 0.28 Acre Lot
- Fenced Yard
Parking
- 6 Car Parking Spaces
Home Design
- Entry on the 1st floor
Interior Spaces
- 1 Fireplace
- Basement
- Laundry in Basement
Kitchen
- Oven
- Range
- Microwave
- Dishwasher
Bedrooms and Bathrooms
- 2 Bedrooms
- Primary Bedroom on Main
- 1 Full Bathroom
Laundry
- Dryer
- Washer
Outdoor Features
- Patio
Location
- Property is near public transit
- Property is near schools
Utilities
- No Cooling
- Heating System Uses Natural Gas
Listing and Financial Details
- Security Deposit $2,600
- 12 Month Lease Term
- Assessor Parcel Number 2005347
Community Details
Overview
- No Home Owners Association
Amenities
- Medical Services
- Shops
Recreation
- Park
- Jogging Path
Pet Policy
- No Pets Allowed
Map
Source: MLS Property Information Network (MLS PIN)
MLS Number: 73450307
APN: LYNN-000083-000709-000058
Disclaimer: Certain information contained herein is derived from information provided by parties other than Homes.com. All information provided is deemed reliable, but is not guaranteed to be accurate and should be independently verified.
![]() The property listing data and information, or the Images, set forth herein were provided to MLS Property Information Network, Inc. from third party sources, including sellers, lessors and public records, and were compiled by MLS Property Information Network, Inc. The property listing data and information, and the Images, are for the personal, non-commercial use of consumers having a good faith interest in purchasing or leasing listed properties of the type displayed to them and may not be used for any purpose other than to identify prospective properties which such consumers may have a good faith interest in purchasing or leasing. MLS Property Information Network, Inc. and its subscribers disclaim any and all representations and warranties as to the accuracy of the property listing data and information, or as to the accuracy of any of the Images, set forth herein.
The property listing data and information, or the Images, set forth herein were provided to MLS Property Information Network, Inc. from third party sources, including sellers, lessors and public records, and were compiled by MLS Property Information Network, Inc. The property listing data and information, and the Images, are for the personal, non-commercial use of consumers having a good faith interest in purchasing or leasing listed properties of the type displayed to them and may not be used for any purpose other than to identify prospective properties which such consumers may have a good faith interest in purchasing or leasing. MLS Property Information Network, Inc. and its subscribers disclaim any and all representations and warranties as to the accuracy of the property listing data and information, or as to the accuracy of any of the Images, set forth herein.
- 94 Sheridan St
- 30 Adams St
- 14 Mount Pleasant Place
- 12 Chestnut Ave
- 344 Essex St
- 16 Hollingsworth St
- 380 Essex St
- 42 Joyce St Unit H
- 440 Essex St
- 248 Essex St
- 14 Jewetts Ct
- 249 Chatham St
- 0 High St
- 106 Goodridge St
- 44 Eutaw Ave
- 30 Clifton Ave
- 175 Essex St
- 129 Williams Ave
- 14-16 Dexter St
- 69 Hawthorne St
- 25 Adams St Unit 1
- 5 Libby Ct
- 290-292 Chestnut St Unit 1
- 290-292 Chestnut St Unit 3
- 277 Chestnut St Unit 1
- 138 Fayette St Unit 1
- 6 Apple St Unit 3
- 185 Chestnut St Unit 2R
- 124 W Green St Unit 201
- 4 Kingsley Terrace Unit 11
- 2 Kingsley Terrace Unit 7
- 472 Essex St Unit 103
- 472 Essex St Unit 401
- 472 Essex St Unit 102
- 472 Essex St Unit 303
- 472 Essex St Unit 101
- 124 Chestnut St Unit 2R
- 34 Herbert St Unit 6
- 77 Green St Unit 17
- 77 Green St Unit 24
