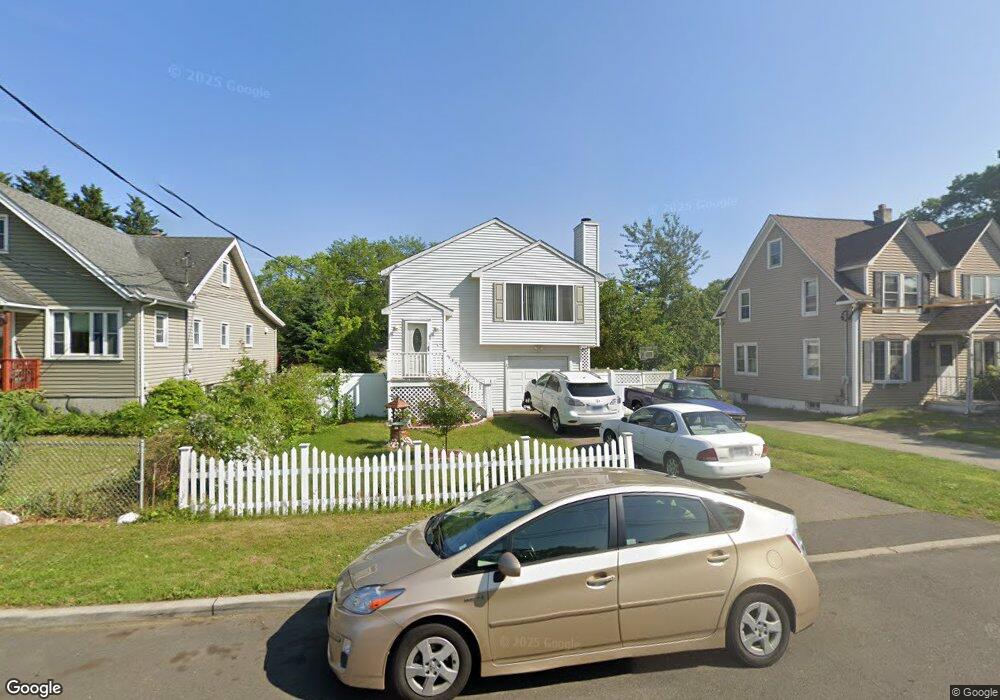
24 Matthews St Milford, CT 06460
Devon NeighborhoodEstimated Value: $551,000 - $744,000
3
Beds
2
Baths
1,403
Sq Ft
$445/Sq Ft
Est. Value
About This Home
This home is located at 24 Matthews St, Milford, CT 06460 and is currently estimated at $624,951, approximately $445 per square foot. 24 Matthews St is a home located in New Haven County with nearby schools including J.F. Kennedy School, West Shore Middle School, and Jonathan Law High School.
Ownership History
Date
Name
Owned For
Owner Type
Purchase Details
Closed on
May 13, 2015
Sold by
Dasilva Ijuracy and Dasilva Amalia
Bought by
Dasilva Ijuracy and Sliva Amalia
Current Estimated Value
Home Financials for this Owner
Home Financials are based on the most recent Mortgage that was taken out on this home.
Original Mortgage
$147,000
Outstanding Balance
$52,864
Interest Rate
2.95%
Mortgage Type
New Conventional
Estimated Equity
$572,087
Purchase Details
Closed on
Apr 25, 2008
Sold by
Delle David E and Brantley Greta M
Bought by
Dasilva Juracy and Dasilva Amalia
Home Financials for this Owner
Home Financials are based on the most recent Mortgage that was taken out on this home.
Original Mortgage
$155,000
Interest Rate
6.22%
Purchase Details
Closed on
Apr 15, 1998
Sold by
Whitney Prop Dev Llc
Bought by
Pelle David E and Brantley Greta M
Create a Home Valuation Report for This Property
The Home Valuation Report is an in-depth analysis detailing your home's value as well as a comparison with similar homes in the area
Home Values in the Area
Average Home Value in this Area
Purchase History
| Date | Buyer | Sale Price | Title Company |
|---|---|---|---|
| Dasilva Ijuracy | -- | -- | |
| Dasilva Ijuracy | -- | -- | |
| Dasilva Juracy | $315,000 | -- | |
| Dasilva Juracy | $315,000 | -- | |
| Pelle David E | $149,900 | -- | |
| Pelle David E | $149,900 | -- |
Source: Public Records
Mortgage History
| Date | Status | Borrower | Loan Amount |
|---|---|---|---|
| Open | Dasilva Ijuracy | $147,000 | |
| Previous Owner | Pelle David E | $153,600 | |
| Previous Owner | Pelle David E | $155,000 |
Source: Public Records
Tax History Compared to Growth
Tax History
| Year | Tax Paid | Tax Assessment Tax Assessment Total Assessment is a certain percentage of the fair market value that is determined by local assessors to be the total taxable value of land and additions on the property. | Land | Improvement |
|---|---|---|---|---|
| 2025 | $7,022 | $237,640 | $76,780 | $160,860 |
| 2024 | $6,925 | $237,640 | $76,780 | $160,860 |
| 2023 | $6,457 | $237,640 | $76,780 | $160,860 |
| 2022 | $6,333 | $237,640 | $76,780 | $160,860 |
| 2021 | $5,619 | $203,220 | $52,400 | $150,820 |
| 2020 | $5,625 | $203,220 | $52,400 | $150,820 |
| 2019 | $5,631 | $203,220 | $52,400 | $150,820 |
| 2018 | $5,637 | $203,220 | $52,400 | $150,820 |
| 2017 | $5,647 | $203,220 | $52,400 | $150,820 |
| 2016 | $5,504 | $197,710 | $52,350 | $145,360 |
| 2015 | $5,512 | $197,710 | $52,350 | $145,360 |
| 2014 | $5,382 | $197,710 | $52,350 | $145,360 |
Source: Public Records
Map
Nearby Homes
- 10 Eastern Pkwy
- 12 Woodland Dr
- 67 Lincoln Ave
- 18 Dewey Ave
- 27 S Kerema Ave
- 15 Pickett St
- 82 Miller Ave
- 261 Bridgeport Ave
- 20 Ormond St
- 48 Hubbell Place
- 51 Sachem St
- 26 Bridgeport Ave
- 775 Milford Point Rd
- 77 Berkeley Terrace
- 295 Housatonic Dr
- 181 Eastern Pkwy
- 47 Peak Ave
- 6 Spindrift Ln
- 83 Berwyn St
- 66 Birch Ave
- 28 Matthews St
- 18 Matthews St
- 32 Matthews St
- 10 Matthews St
- 10 Matthews St
- 21 Matthews St
- 15 Matthews St
- 11 Matthews St
- 52 Oregon Ave N
- 7 Matthews St
- 7 Matthews St Unit 7
- 7 Matthews St Unit 7
- 7 Matthews St
- 5 Mathew St Unit 5
- 18 Baldwin St
- 5 Matthews St
- 5 Matthews St Unit 5
- 55 Hobson Ave
- 12 Baldwin St
- 438 Naugatuck Ave